Table of Contents
Viechtbauer (2007)
The Methods and Data
Viechtbauer (2007) is a general article about meta-analysis focusing in particular on random- and mixed-effects (meta-regression) models. An example dataset, based on a meta-analysis by Linde et al. (2005) examining the effectiveness of Hypericum perforatum extracts (St. John's wort) for treating depression, is used in the paper to illustrate the various methods. The data are given in the paper in Table 1 (p. 105).
The dataset can be recreated with:
library(metafor)
dat <- escalc(measure="RR", ai=ai, ci=ci, n1i=n1i, n2i=n2i, data=dat.linde2005)
dat <- dat[c(7:10,13:25), c(13:16,18:19,11,6,7,9)]
dat$dosage <- (dat$dosage * 7) / 1000
rownames(dat) <- 1:nrow(dat)
dat
The contents of the dataset are then:
   ai n1i ci n2i      yi     vi dosage major baseline duration
1  20  25 11  25  0.5978 0.0609   2.66     0     19.5        8
2  14  20  9  20  0.4418 0.0825   6.30     0     12.5        4
3   4  25  2  25  0.6931 0.6700   6.30     1     22.7        4
4  20  32  6  33  1.2347 0.1551   6.30     0     16.5        6
5  28  50 13  55  0.8626 0.0745   6.30     0     15.8        4
6  34  48 25  49  0.3281 0.0282   1.68     1     23.6        6
7  35  53 12  54  1.0891 0.0745   6.30     1     20.7        4
8  24  49 16  49  0.4055 0.0634   6.30     1     21.1        6
9  45  80 12  79  1.3092 0.0804   3.50     1     19.4        6
10 67 106 22  47  0.3004 0.0297   7.35     1     22.7        6
11 34  60 17  59  0.6763 0.0546   6.30     0     16.7        6
12 46  70 34  70  0.3023 0.0226   3.50     1     20.9        6
13 55 123 57 124 -0.0276 0.0195   6.30     1     21.5        6
14 23  37 15  35  0.3719 0.0545   6.30     1     19.9        6
15 26  98 19 102  0.3537 0.0711   7.35     1     22.5        8
16 46 113 56 116 -0.1705 0.0221   8.40     1     22.9        8
17 98 186 80 189  0.2189 0.0120   6.30     1     21.9        6
Variables ai and ci indicate the number of participants with significant improvements between baseline and the follow-up assessment in the treatment and the placebo group, respectively, variables n1i and n2i are the corresponding group sizes, variable yi is the log of the relative improvement rate (i.e., the improvement rate in the treatment group divided by the improvement rate in the placebo group), vi is the corresponding sampling variance, dosage is the weekly dosage (in grams) of the Hypericum extract used in each study, major indicates whether a study was restricted to participants with major depression or not (1 or 0, respectively), baseline denotes the average score on the Hamilton Rating Scale for Depression (HRSD) at baseline (i.e., before the treatment), and duration indicates the number of treatment weeks between the baseline and the response assessment. Variables yi and vi are not actually included in the original dataset and were added by means of the escalc() function.
Note that, for illustration purposes, only a subset of the data from the Linde et al. (2005) meta-analysis are actually included in this example. Therefore, no substantive interpretations should be attached to the results of the analyses given below.
Results of the Individual Studies
Based on the log relative improvement rates and corresponding sampling variances, we can compute confidence intervals for the relative improvements rates with:
summary(dat, transf=exp, digits=2)
   ai n1i ci n2i   yi dosage major baseline duration ci.lb ci.ub
1  20  25 11  25 1.82   2.66     0     19.5        8  1.12  2.95
2  14  20  9  20 1.56   6.30     0     12.5        4  0.89  2.73
.
13 55 123 57 124 0.97   6.30     1     21.5        6  0.74  1.28
.
17 98 186 80 189 1.24   6.30     1     21.9        6  1.00  1.54
With transf=exp, the values of the outcome measure (i.e., the log relative improvement rates) and corresponding confidence interval bounds are exponentiated and hence transformed back from the log scale. Therefore, variable yi now indicates the relative improvement rate, and ci.lb and ci.ub are the bounds of an approximate 95% confidence interval for the true relative improvement rate in the individual studies (note that this is not a permanent change – object dat still contains the log transformed values, which we need for the analyses below).
Homogeneous Situation
The first model discussed in the article assumes that the true relative improvement rates are identical in the various studies and the only reason why the observed relative improvement rates differ from each other is due to sampling error/variability. We can fit this model with:
res <- rma(yi, vi, data=dat, method="EE", digits=2)
res
Equal-Effects Model (k = 17)

I^2 (total heterogeneity / total variability):   68.96%
H^2 (total variability / sampling variability):  3.22

Test for Heterogeneity:
Q(df = 16) = 51.55, p-val < .01

Model Results:

estimate    se  zval  pval  ci.lb  ci.ub
    0.33  0.05  6.78  <.01   0.23   0.42  ***

---
Signif. codes:  0 '***' 0.001 '**' 0.01 '*' 0.05 '.' 0.1 ' ' 1
Since we are analyzing the log of the relative improvement rates, the model estimate also reflects the log relative rate. For easier interpretation, it is useful to back-transform the results with:
predict(res, transf=exp)
 pred ci.lb ci.ub
 1.38  1.26  1.52
Therefore, the estimated relative rate is 1.38 with an approximate 95% CI of 1.26 to 1.52. However, the Q-test suggests that the true (log) relative rates are not homogeneous.
Heterogeneous Situation
Given that the true (log) relative rates are apparently heterogeneous, we can consider two possibilities:
- We can interpret the model estimate obtained above as an estimate of the (weighted) average of the true log relative rates for these 17 studies. This is the so-called fixed-effects model, which allows us to make a conditional inference (about the average effect) that only pertains to this set of studies. For a more in-depth discussion of the fixed-effects model, see here.
- We can model the heterogeneity in the true log relative rates and apply a random-effects model. This allows us to make an unconditional inference about a larger population of studies from which the included set of studies are assumed to be a random selection.
Let's take the second approach now. To fit a random-effects model to these data (using the DL estimator for the amount of heterogeneity), we can use the code:
res <- rma(yi, vi, data=dat, method="DL", digits=2)
res
Random-Effects Model (k = 17; tau^2 estimator: DL)

tau^2 (estimated amount of total heterogeneity): 0.09 (SE = 0.05)
tau (square root of estimated tau^2 value):      0.30
I^2 (total heterogeneity / total variability):   68.96%
H^2 (total variability / sampling variability):  3.22

Test for Heterogeneity:
Q(df = 16) = 51.55, p-val < .01

Model Results:

estimate    se  zval  pval  ci.lb  ci.ub
    0.45  0.09  4.87  <.01   0.27   0.63  ***

---
Signif. codes:  0 ‘***’ 0.001 ‘**’ 0.01 ‘*’ 0.05 ‘.’ 0.1 ‘ ’ 1
Again, for easier interpretation, we can back-transform the results from the log-scale with:
predict(res, transf=exp)
 pred ci.lb ci.ub pi.lb pi.ub
 1.57  1.31  1.89  0.85  2.91
Therefore, we estimate that the average relative improvement rate is equal to 1.57 with an approximate 95% confidence interval of 1.31 to 1.89. The values under pi.lb and pi.ub are the bounds of an approximate 95% prediction interval for the true improvement rate of an individual study in the population of studies.1)
Meta-Regression
The random-effects model assumes that the heterogeneity in the true (log) relative rates is purely random. However, it may actually be the case that differences in the relative rates are (at least in part) systematic and related to study-level variables (moderators), such as the treatment intensity and the severity of the depression in the group of patients being treated. For reasons that are explained in more detail in the article, treatment intensity will be expressed in terms of a single moderator that indicates the total dosage (in grams) administered during the course of each study. We can create this variable with:
dat$dosage <- dat$dosage * dat$duration
The baseline HRSD score will be used to reflect the severity of the depression in the patients. Since these two variables may interact, their product will also be included in the model. Finally, for easier interpretation, we will center the variables at (roughly) their means when including them in the model.
We can fit a mixed-effects meta-regression model with these moderators to the data with:
res <- rma(yi, vi, mods = ~ I(dosage-34) * I(baseline-20), data=dat, method="DL")
res
The results are:
Mixed-Effects Model (k = 17; tau^2 estimator: DL)

tau^2 (estimated amount of residual heterogeneity):     0.0475 (SE = 0.0376)
tau (square root of estimated tau^2 value):             0.2179
I^2 (residual heterogeneity / unaccounted variability): 53.56%
H^2 (unaccounted variability / sampling variability):   2.15
R^2 (amount of heterogeneity accounted for):            47.38%

Test for Residual Heterogeneity:
QE(df = 13) = 27.9903, p-val = 0.0091

Test of Moderators (coefficients 2:4):
QM(df = 3) = 10.1280, p-val = 0.0175

Model Results:

                                 estimate      se     zval    pval    ci.lb   ci.ub
intrcpt                            0.4763  0.0876   5.4342  <.0001   0.3045  0.6480  ***
I(dosage - 34)                    -0.0058  0.0100  -0.5846  0.5588  -0.0254  0.0138
I(baseline - 20)                  -0.0672  0.0352  -1.9086  0.0563  -0.1363  0.0018    .
I(dosage - 34):I(baseline - 20)   -0.0016  0.0034  -0.4555  0.6487  -0.0083  0.0052

---
Signif. codes:  0 ‘***’ 0.001 ‘**’ 0.01 ‘*’ 0.05 ‘.’ 0.1 ‘ ’ 1
These are the same results as given in Table 2 on page 113. Therefore, it appears that St. John's wort is more effective for lower baseline HRSD scores (the coefficient is negative, but just misses being significant at $\alpha = .05$ with $p = .06$). On the other hand, the total dosage of St. John's wort administered during the course of a study does not appear to be related to the treatment effectiveness ($p = .56$) and there does not appear to be an interaction between the two moderators ($p = .65$).
Based on the model, we can compute predicted (average) relative improvement rates for various baseline HRSD scores at a given total dosage value. For example, for a total dosage equal to 34 (roughly the mean value in the set of studies) and a baseline HRSD score of 12.5 or 23.6, we obtain these estimates:
predict(res, newmods=c(34-34, 12.5-20, (34-34)*(12.5-20)), transf=exp, digits=2)
predict(res, newmods=c(34-34, 23.6-20, (34-34)*(23.6-20)), transf=exp, digits=2)
 pred ci.lb ci.ub pi.lb pi.ub
 2.67  1.46  4.88  1.27  5.59
 pred ci.lb ci.ub pi.lb pi.ub
 1.26  0.99  1.61  0.77  2.07
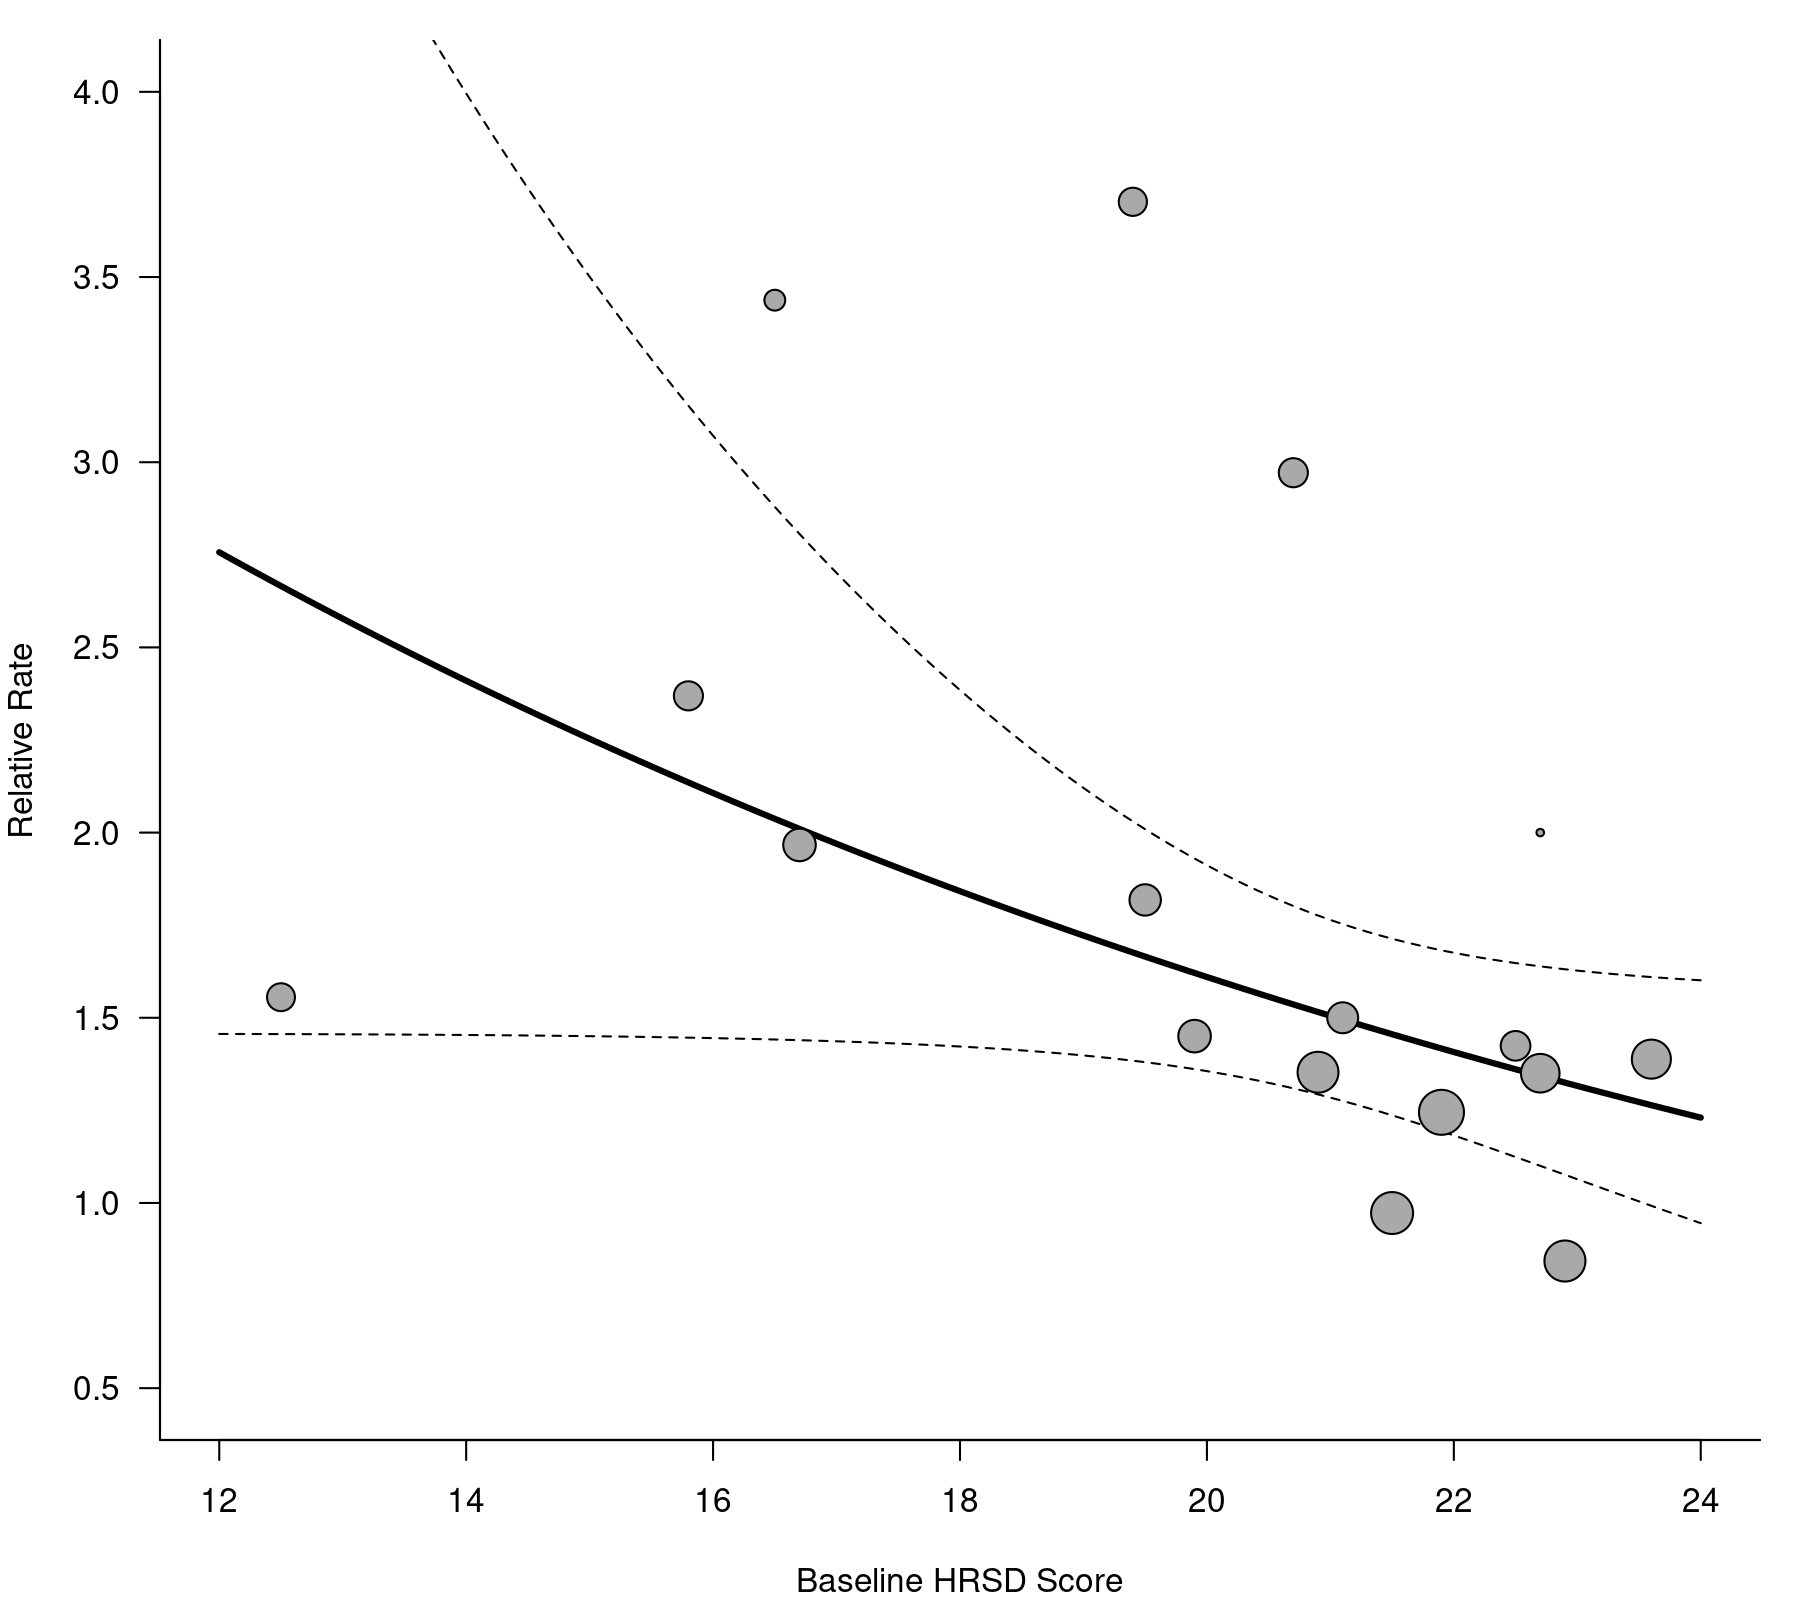
So, for a low baseline HRSD score (i.e., for mildly depressed patients), the estimated average relative improvement rate is quite high (2.67 with 95% CI: 1.46 to 4.88), but at a high baseline HRSD score (i.e., for more severely depressed patients), the estimated average relative improvement rate is low (1.26 with 95% CI: 0.99 to 1.61) and in fact not significantly different from 1.
As shown in Figure 3 in the article, we can illustrate these results with a scatterplot of the data, superimposing a line (or rather: curve after the back-transformation) with the estimated average relative improvement rate based on the model for different baseline HRSD scores, holding the total dosage value constant at 34. This figure can be re-created with:
xvals   <- seq(12, 24, by=0.1) - 20
modvals <- cbind(0, cbind(xvals, 0))
preds   <- predict(res, modvals)

regplot(res, mod=3, pred=preds, xvals=xvals,
        shade=FALSE, bty="l", las=1, digits=1, transf=exp,
        xlim=c(12,24)-20, ylim=c(0.5,4), xaxt="n",
        xlab="Baseline HRSD Score", ylab="Relative Rate")
axis(side=1, at=seq(12, 24, by=2) - 20, labels=seq(12, 24, by=2))
References
Linde, K., Berner, M., Egger, M., & Mulrow, C. (2005). St John's wort for depression: Meta-analysis of randomised controlled trials. British Journal of Psychiatry, 186, 99–107.
Viechtbauer, W. (2007). Accounting for heterogeneity via random-effects models and moderator analyses in meta-analysis. Zeitschrift für Psychologie / Journal of Psychology, 215(2), 104–121.