Handling Missing Data in Output/Figures
In many cases, the dataset to be used for a meta-analysis will contain studies for which insufficient information is available to compute the observed outcomes (e.g., the risk/odds ratios or the raw/standardized mean differences) or for which the values of potentially relevant moderators/covariates are unknown. We can use the dataset for the BCG vaccine meta-analysis (Colditz et al., 1994) as an illustration.
Suppose the 2×2 table data for the 6th study were not available and let's make the absolute latitude value for the 8th study missing:
library(metafor)
dat.bcg[6,4:7] <- NA
dat.bcg$ablat[8] <- NA
dat.bcg
   trial               author year tpos  tneg cpos  cneg ablat      alloc
1      1              Aronson 1948    4   119   11   128    44     random
2      2     Ferguson & Simes 1949    6   300   29   274    55     random
3      3      Rosenthal et al 1960    3   228   11   209    42     random
4      4    Hart & Sutherland 1977   62 13536  248 12619    52     random
5      5 Frimodt-Moller et al 1973   33  5036   47  5761    13  alternate
6      6      Stein & Aronson 1953   NA    NA   NA    NA    44  alternate
7      7     Vandiviere et al 1973    8  2537   10   619    19     random
8      8           TPT Madras 1980  505 87886  499 87892    NA     random
9      9     Coetzee & Berjak 1968   29  7470   45  7232    27     random
10    10      Rosenthal et al 1961   17  1699   65  1600    42 systematic
11    11       Comstock et al 1974  186 50448  141 27197    18 systematic
12    12   Comstock & Webster 1969    5  2493    3  2338    33 systematic
13    13       Comstock et al 1976   27 16886   29 17825    33 systematic
Now suppose we want to fit a random-effects model to these data, using the (log) risk ratio as the outcome measure. We can do this with:
dat <- escalc(measure="RR", ai=tpos, bi=tneg, ci=cpos, di=cneg, data=dat.bcg)
res <- rma(yi, vi, data=dat, slab=paste0(trial, ") ", author, ", ", year))
A warning will be issued by the rma function, since the log risk ratio could not be computed for the 6th study, leading to missing data (NA values):
Warning message:
In rma(measure = "RR", ai = tpos, bi = tneg, ci = cpos, di = cneg,  :
  Studies with NAs omitted from model fitting.
We can now draw a forest plot based on the results from the meta-analysis with:
forest(res, atransf=exp, at=log(c(0.05, 0.25, 1, 4)), xlim=c(-9,6))
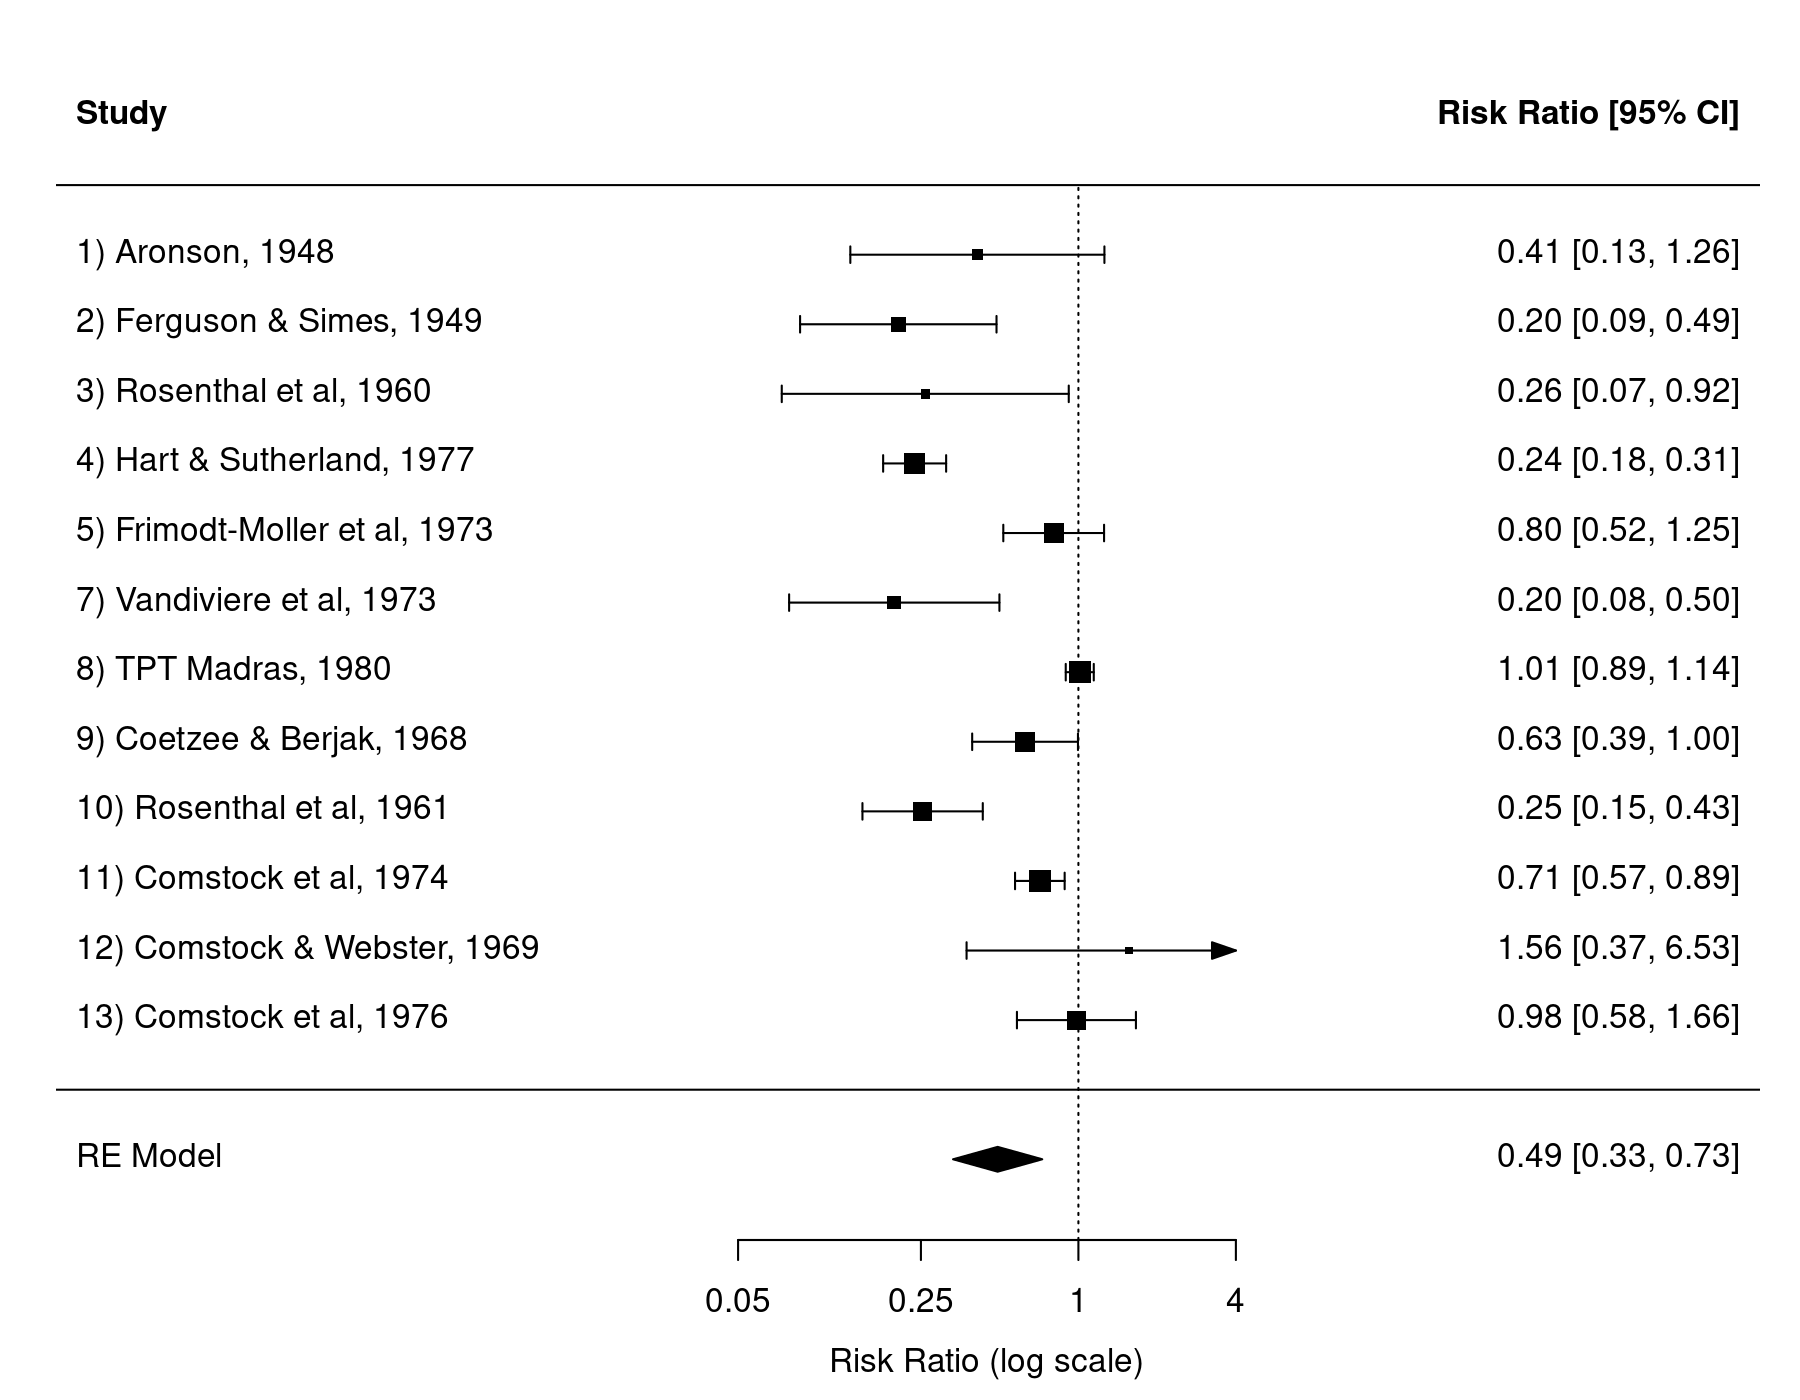
As we can see, the 6th study has been omitted from the forest plot. However, we may still want to have the study included in the forest plot (e.g., as a visual cue that the study did in fact exist). This is possible by changing the na.action option under the global options (see help(options) for more details on options settings). In particular, the default setting in R for na.action is na.omit, which results in the behavior shown above.
We can change this with:
options(na.action = "na.pass")
Various functions in the metafor package will now let missing values pass on to the output and figures. We can now redraw the forest plot:
forest(res, atransf=exp, at=log(c(0.05, 0.25, 1, 4)), xlim=c(-9,6))

And now, the 6th study is shown in the plot (of course, since the log risk ratio and corresponding CI cannot be computed, the actual results remain missing).
When inspecting output, this issue may also be relevant. For example, suppose we fit a mixed-effects meta-regression model to the log risk ratios using the absolute latitude of the study location as a potential moderator:
res <- rma(yi, vi, mods = ~ ablat, data=dat)
Again, a warning will be issued, since parts of the data were missing (i.e., the yi and vi values for the 6th study and the ablat value for the 8th study).
Now we want to inspect the studentized residuals for these studies. The default behavior (with the na.action set to na.omit) would be:
options(na.action = "na.omit")
rstudent(res)
     resid     se       z
1   0.2230 0.7158  0.3115
2  -0.2439 0.6860 -0.3555
3  -0.3290 0.7692 -0.4277
4  -0.2053 0.5610 -0.3660
5   0.0198 0.6019  0.0329
7  -1.3702 0.5473 -2.5036
9   0.1728 0.5182  0.3334
10 -0.3928 0.5069 -0.7750
11  0.0442 0.5377  0.0822
12  1.2682 0.8147  1.5566
13  0.8292 0.2767  2.9962
Note that studies 6 and 8 are not shown in the output.
If we want to have vectors of the same length as the original data, we could use:
options(na.action = "na.pass")
rstudent(res)
     resid     se       z
1   0.2230 0.7158  0.3115
2  -0.2439 0.6860 -0.3555
3  -0.3290 0.7692 -0.4277
4  -0.2053 0.5610 -0.3660
5   0.0198 0.6019  0.0329
6       NA     NA      NA
7  -1.3702 0.5473 -2.5036
8       NA     NA      NA
9   0.1728 0.5182  0.3334
10 -0.3928 0.5069 -0.7750
11  0.0442 0.5377  0.0822
12  1.2682 0.8147  1.5566
13  0.8292 0.2767  2.9962
References
Colditz, G. A., Brewer, T. F., Berkey, C. S., Wilson, M. E., Burdick, E., Fineberg, H. V., et al. (1994). Efficacy of BCG vaccine in the prevention of tuberculosis: Meta-analysis of the published literature. Journal of the American Medical Association, 271(9), 698–702.