Table of Contents
Radial (Galbraith) Plot
Description
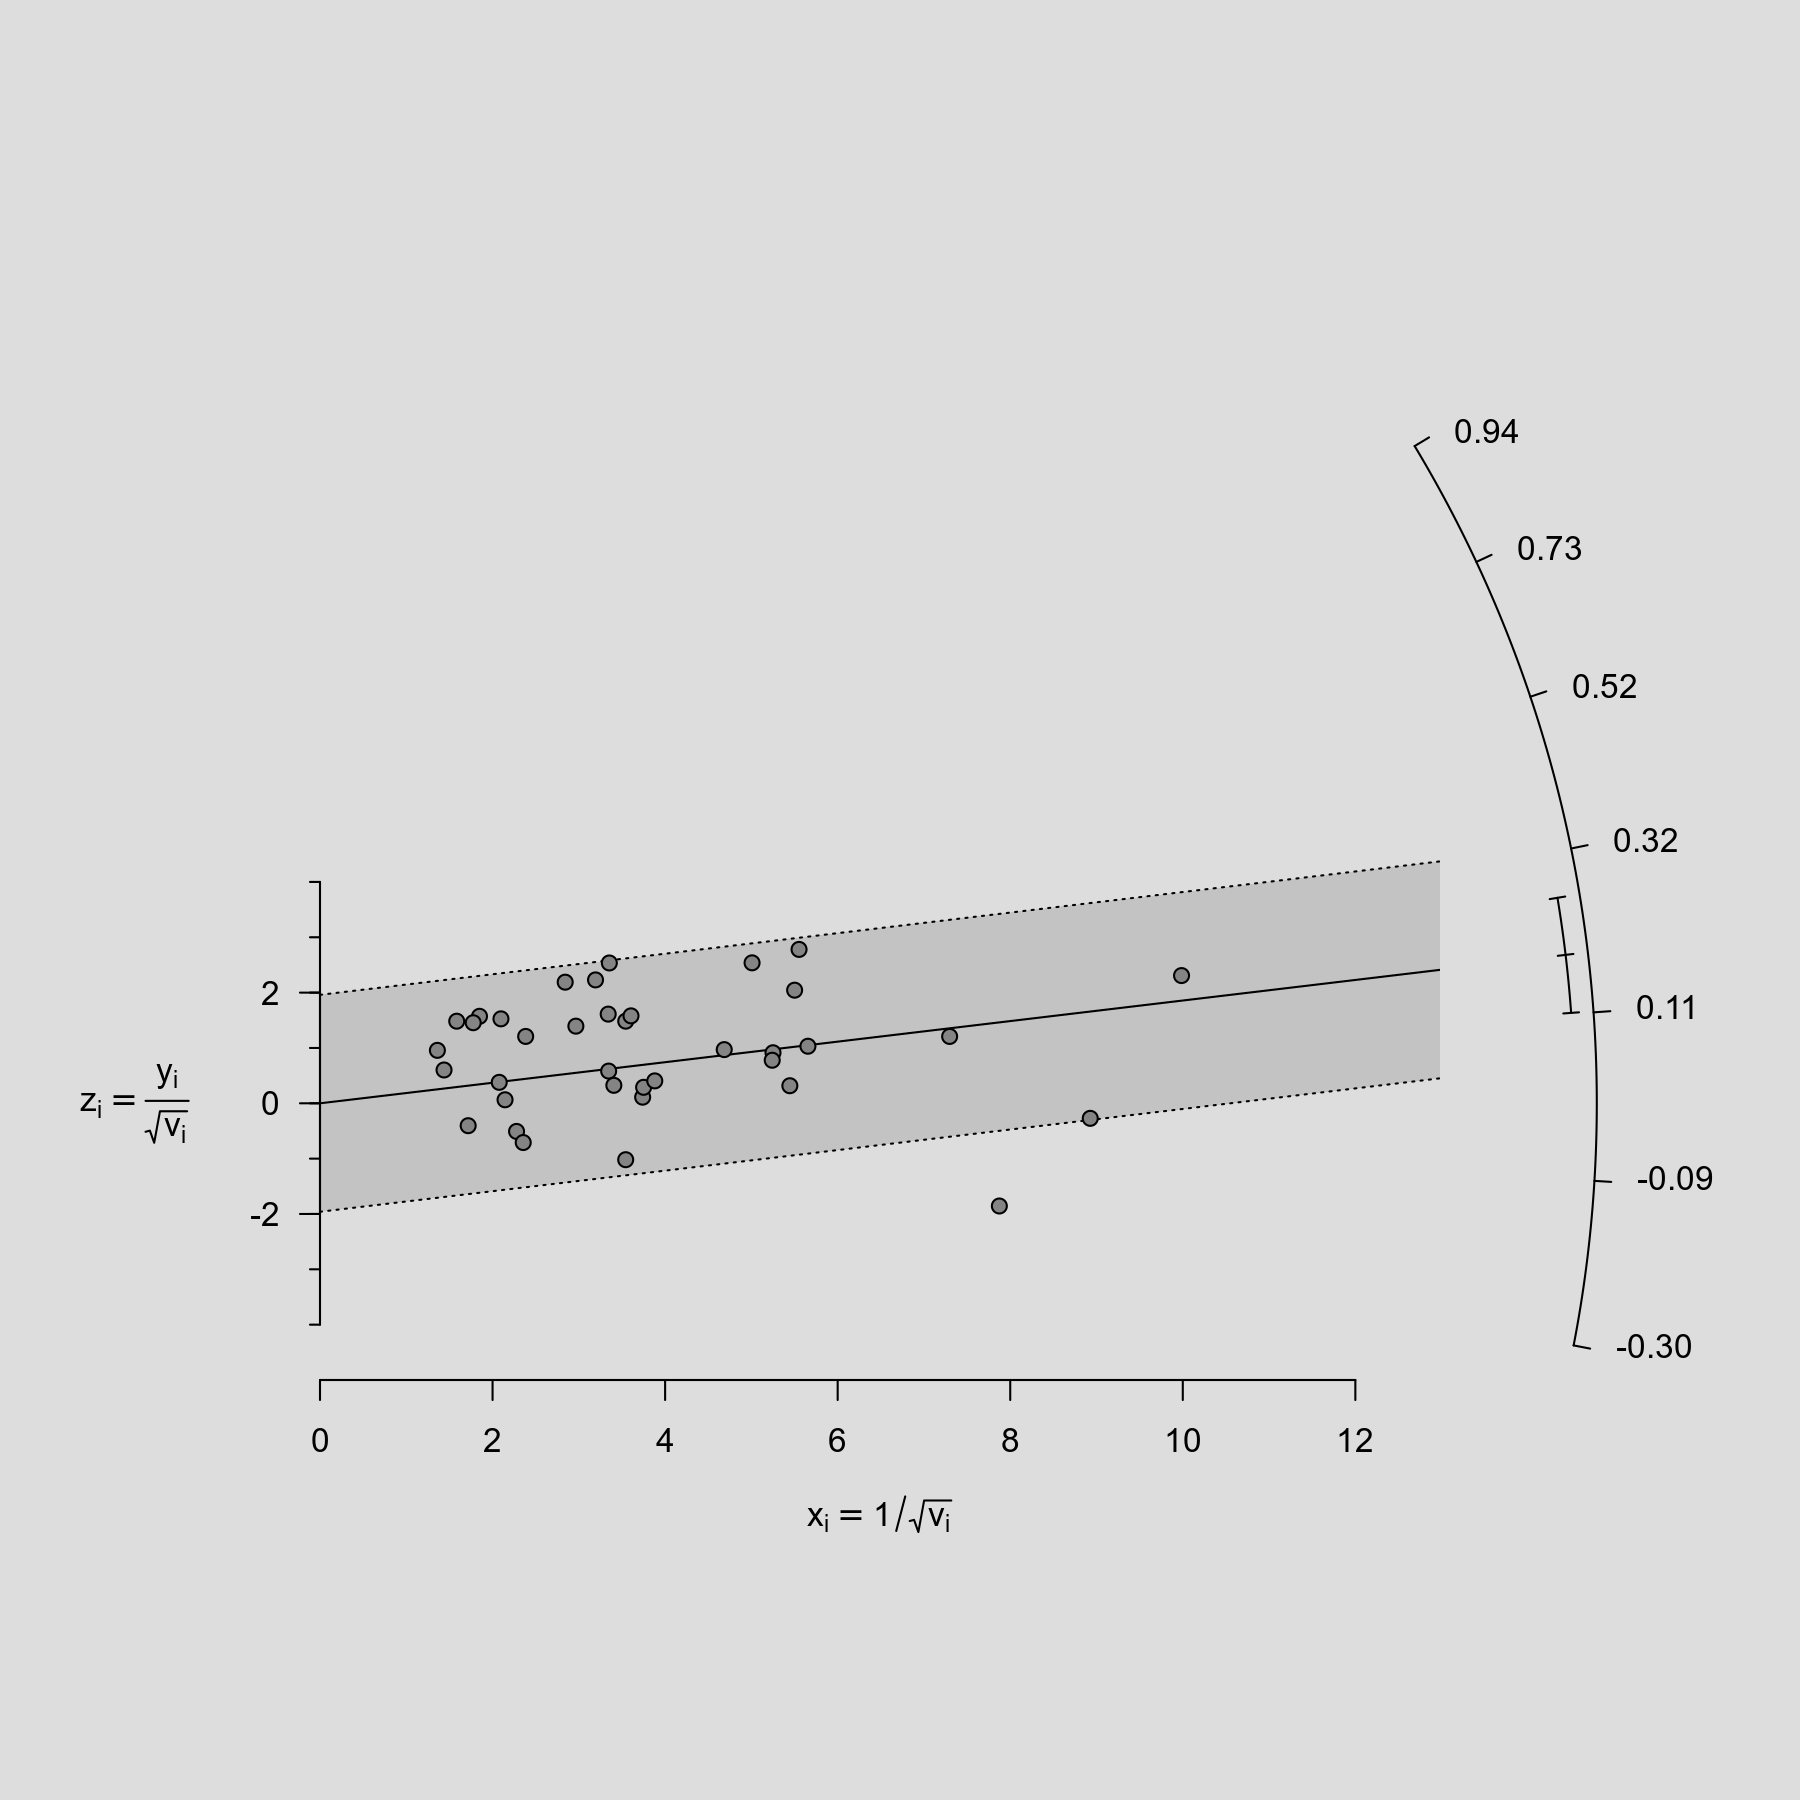
The radial plot (also called Galbraith plot) was introduced by Rex Galbraith (1988a, 1988b, 1994) and can be useful in the meta-analytic context to examine the data for heterogeneity. For an equal-effects model, the plot shows the inverse of the standard errors on the horizontal axis against the observed effect sizes or outcomes standardized by their corresponding standard errors on the vertical axis. On the right hand side of the plot, an arc is drawn corresponding to the observed effect sizes or outcomes. A line projected from (0,0) through a particular point within the plot onto this arc indicates the value of the observed effect size or outcome for that point. An example of such a plot is shown below
Plot
Code
library(metafor)

### fit equal-effects model
res <- rma(yi, vi, data=dat.hackshaw1998, method="EE")

### adjust margins so the space is better used
par(mar=c(5,4,0,3))

### draw radial plot
radial(res)
References
Galbraith, R. F. (1988a). Graphical display of estimates having differing standard errors. Technometrics, 30(3), 271–281.
Galbraith, R. F. (1988b). A note on graphical presentation of estimated odds ratios from several clinical trials. Statistics in Medicine, 7(8), 889–894.
Galbraith, R. F. (1994). Some applications of radial plots. Journal of the American Statistical Association, 89(428), 1232–1242.