plots:caterpillar_plot
Table of Contents
Caterpillar Plot
Description
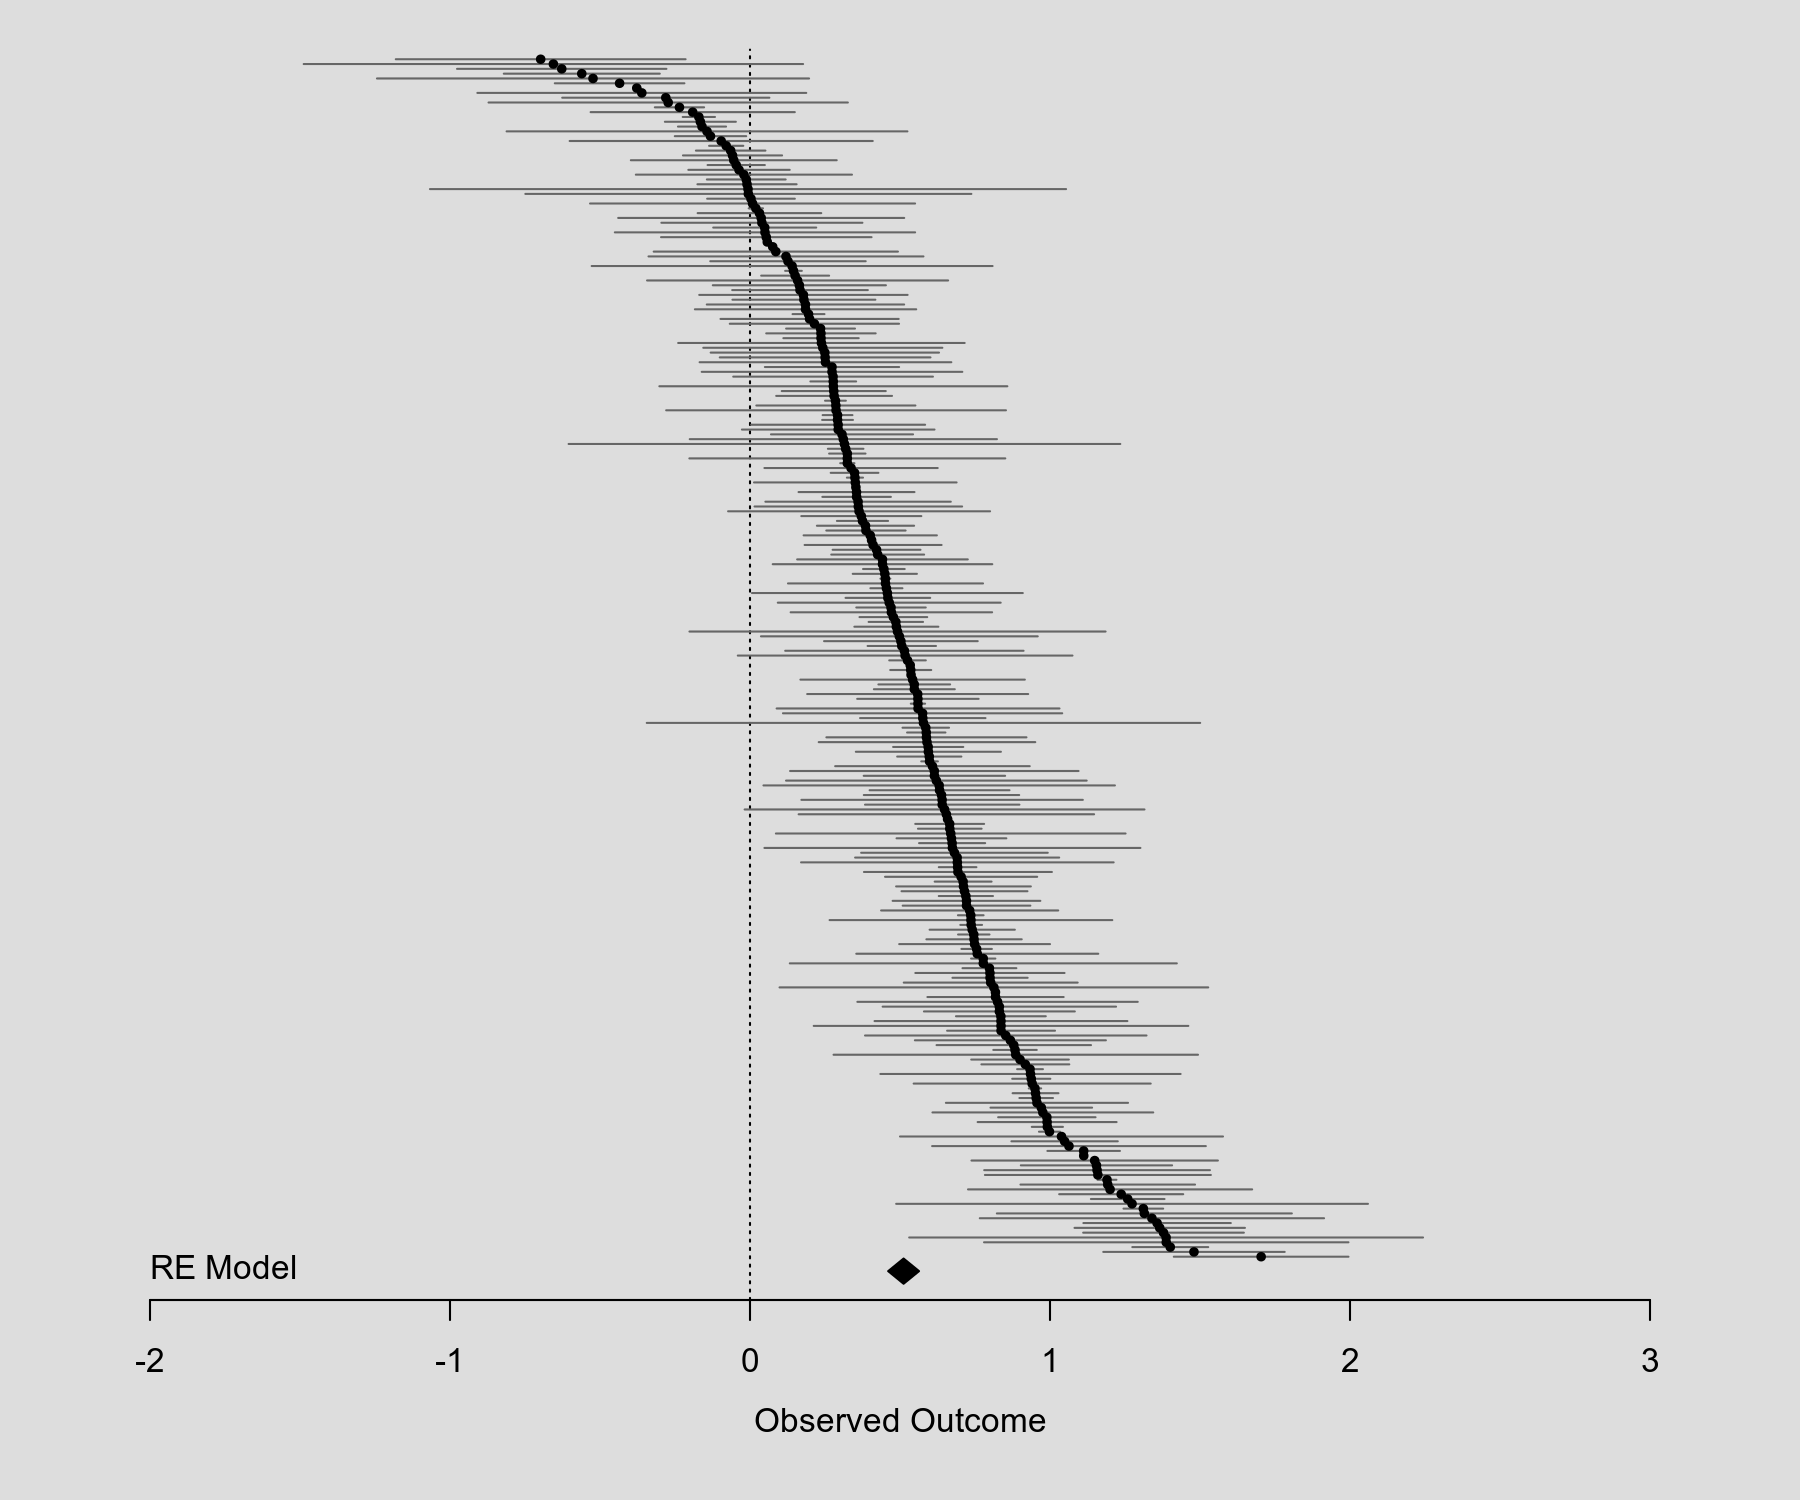
A caterpillar plot is in essence nothing different than what is often called a forest plot in the meta-analytic literature, except that the estimates are ordered by their magnitude. Also, the term tends to be used under circumstances where the number of estimates is rather large, so focus is on showing the general pattern of the results and not making individual estimates fully discernible. The code below shows how such a plot can be created with the forest() function. In case this is needed, one can also add a summary polygon to the bottom of the plot.
Plot
Code
library(metafor)

### simulate some data
set.seed(5132)
k <- 250
vi <- rchisq(k, df=1) * .03
yi <- rnorm(k, rnorm(k, 0.5, 0.4), sqrt(vi))

### fit RE model
res <- rma(yi, vi)

### create plot
forest(yi, vi,
       header=FALSE,            # suppress the header
       xlim=c(-2.5,3.5),        # adjust the horizontal plot limits
       ylim=c(-8,254),          # adjust the vertical plot limits
       order="obs",             # order by size of yi
       slab=NA, annotate=FALSE, # remove study labels and annotations
       efac=c(0,1),             # remove vertical bars at end of CIs
       pch=19,                  # changing point symbol to filled circle
       colci="gray40",          # change color of CIs
       psize=2.5,               # increase point size
       cex.lab=1, cex.axis=1,   # set the size of x-axis title/labels
       lty=c("solid","blank"))  # remove horizontal line at top of plot

### add summary polygon at bottom and text
addpoly(res, mlab="", cex=1)
text(-2, -2, "RE Model", pos=4, offset=0, cex=1)
plots/caterpillar_plot.txt · Last modified: by Wolfgang Viechtbauer