Table of Contents
Normal QQ Plots
Description
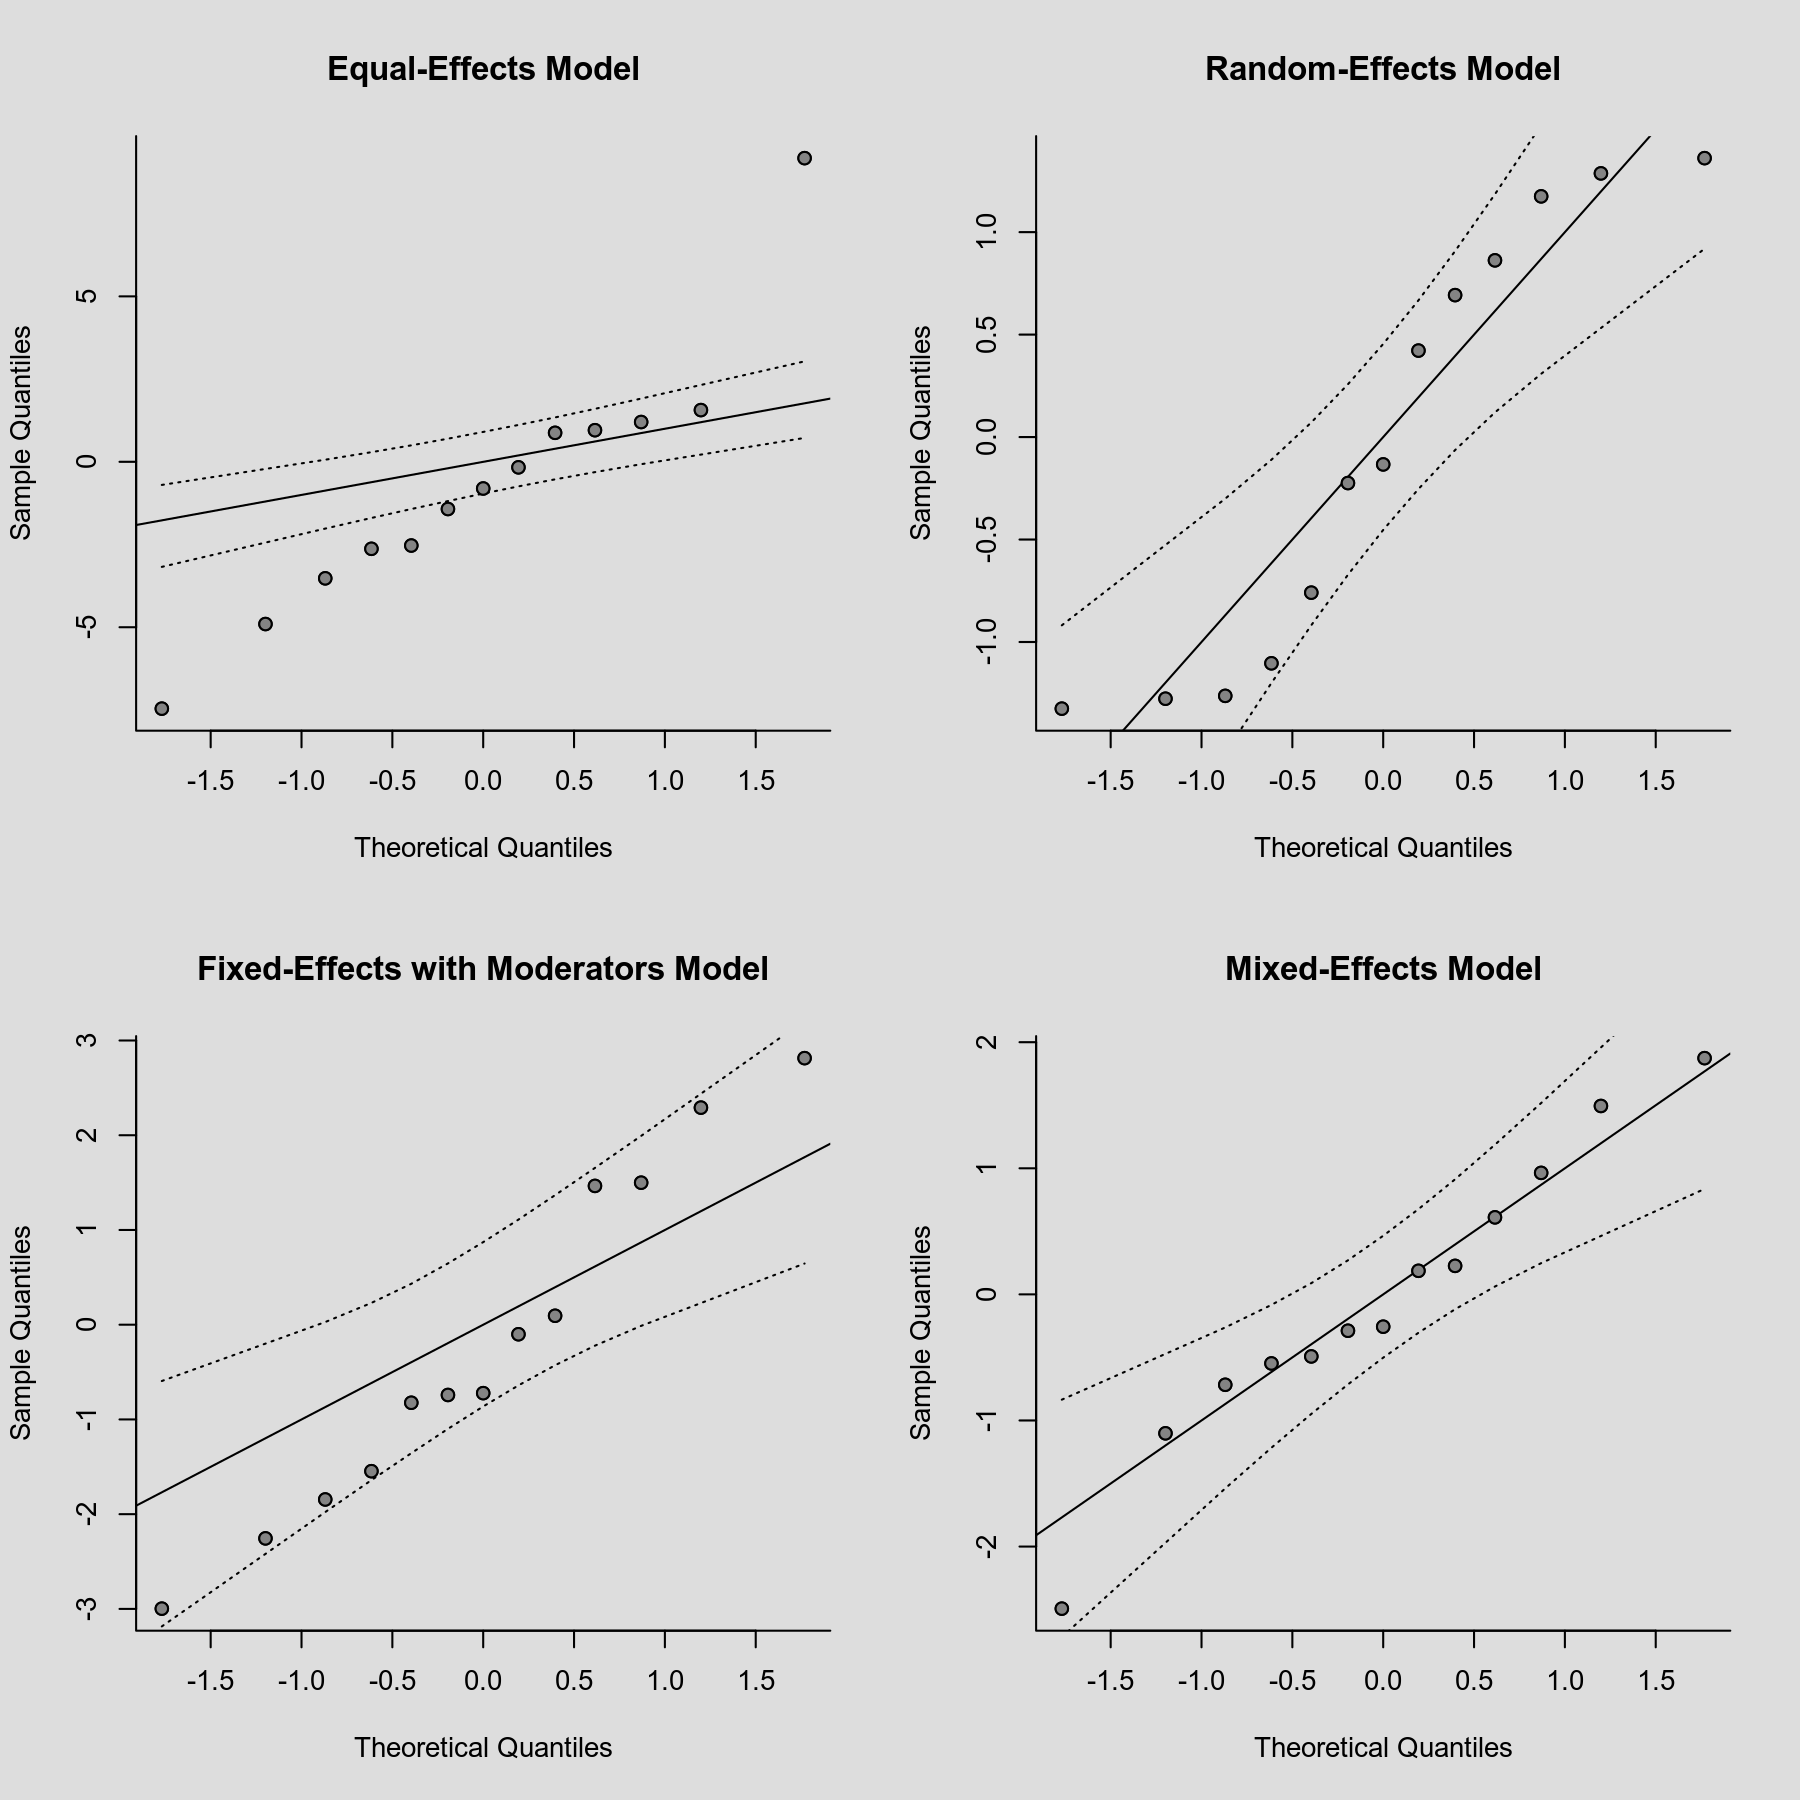
A normal quantile-quantile (QQ) plot can be useful in meta-analyses to check various aspects and assumptions of the data. Ideally, the points in the plot should fall on a diagonal line with slope of 1, going through the (0,0) point. Deviations from this may indicate that (a) the (residual) heterogeneity in the true effects is non-normally distributed, (b) there are subgroups in the data (that are not adequately modeled by any moderators already included in the model), and/or (c) that publication bias is present (for more details, see Wang & Bushman, 1998; see also Cook & Weisberg, 1982, for a more general discussion not directly tied to meta-analysis).
Plot
Code
library(metafor)

### set up 2x2 array for plotting
par(mfrow=c(2,2))

### calculate (log) risk ratios and corresponding sampling variances
dat <- escalc(measure="RR", ai=tpos, bi=tneg, ci=cpos, di=cneg, data=dat.bcg)

### fit equal- and random-effects models
res1 <- rma(yi, vi, data=dat, method="EE")
res2 <- rma(yi, vi, data=dat)

### fit fixed- and random-effects models with absolute latitude moderator
res3 <- rma(yi, vi, mods=~ablat, data=dat, method="FE")
res4 <- rma(yi, vi, mods=~ablat, data=dat)

### normal QQ plots for the various models
qqnorm(res1, main="Equal-Effects Model")
qqnorm(res2, main="Random-Effects Model")
qqnorm(res3, main="Fixed-Effects with Moderators Model")
qqnorm(res4, main="Mixed-Effects Model")
References
Cook, R. D., & Weisberg, S. (1982). Residuals and influence in regression. London: Chapman and Hall.
Wang, M. C., & Bushman, B. J. (1998). Using the normal quantile plot to explore meta-analytic data sets. Psychological Methods, 3(1), 46–54.