This is an old revision of the document!
Table of Contents
Funnel Plot with Limit Estimate
Description
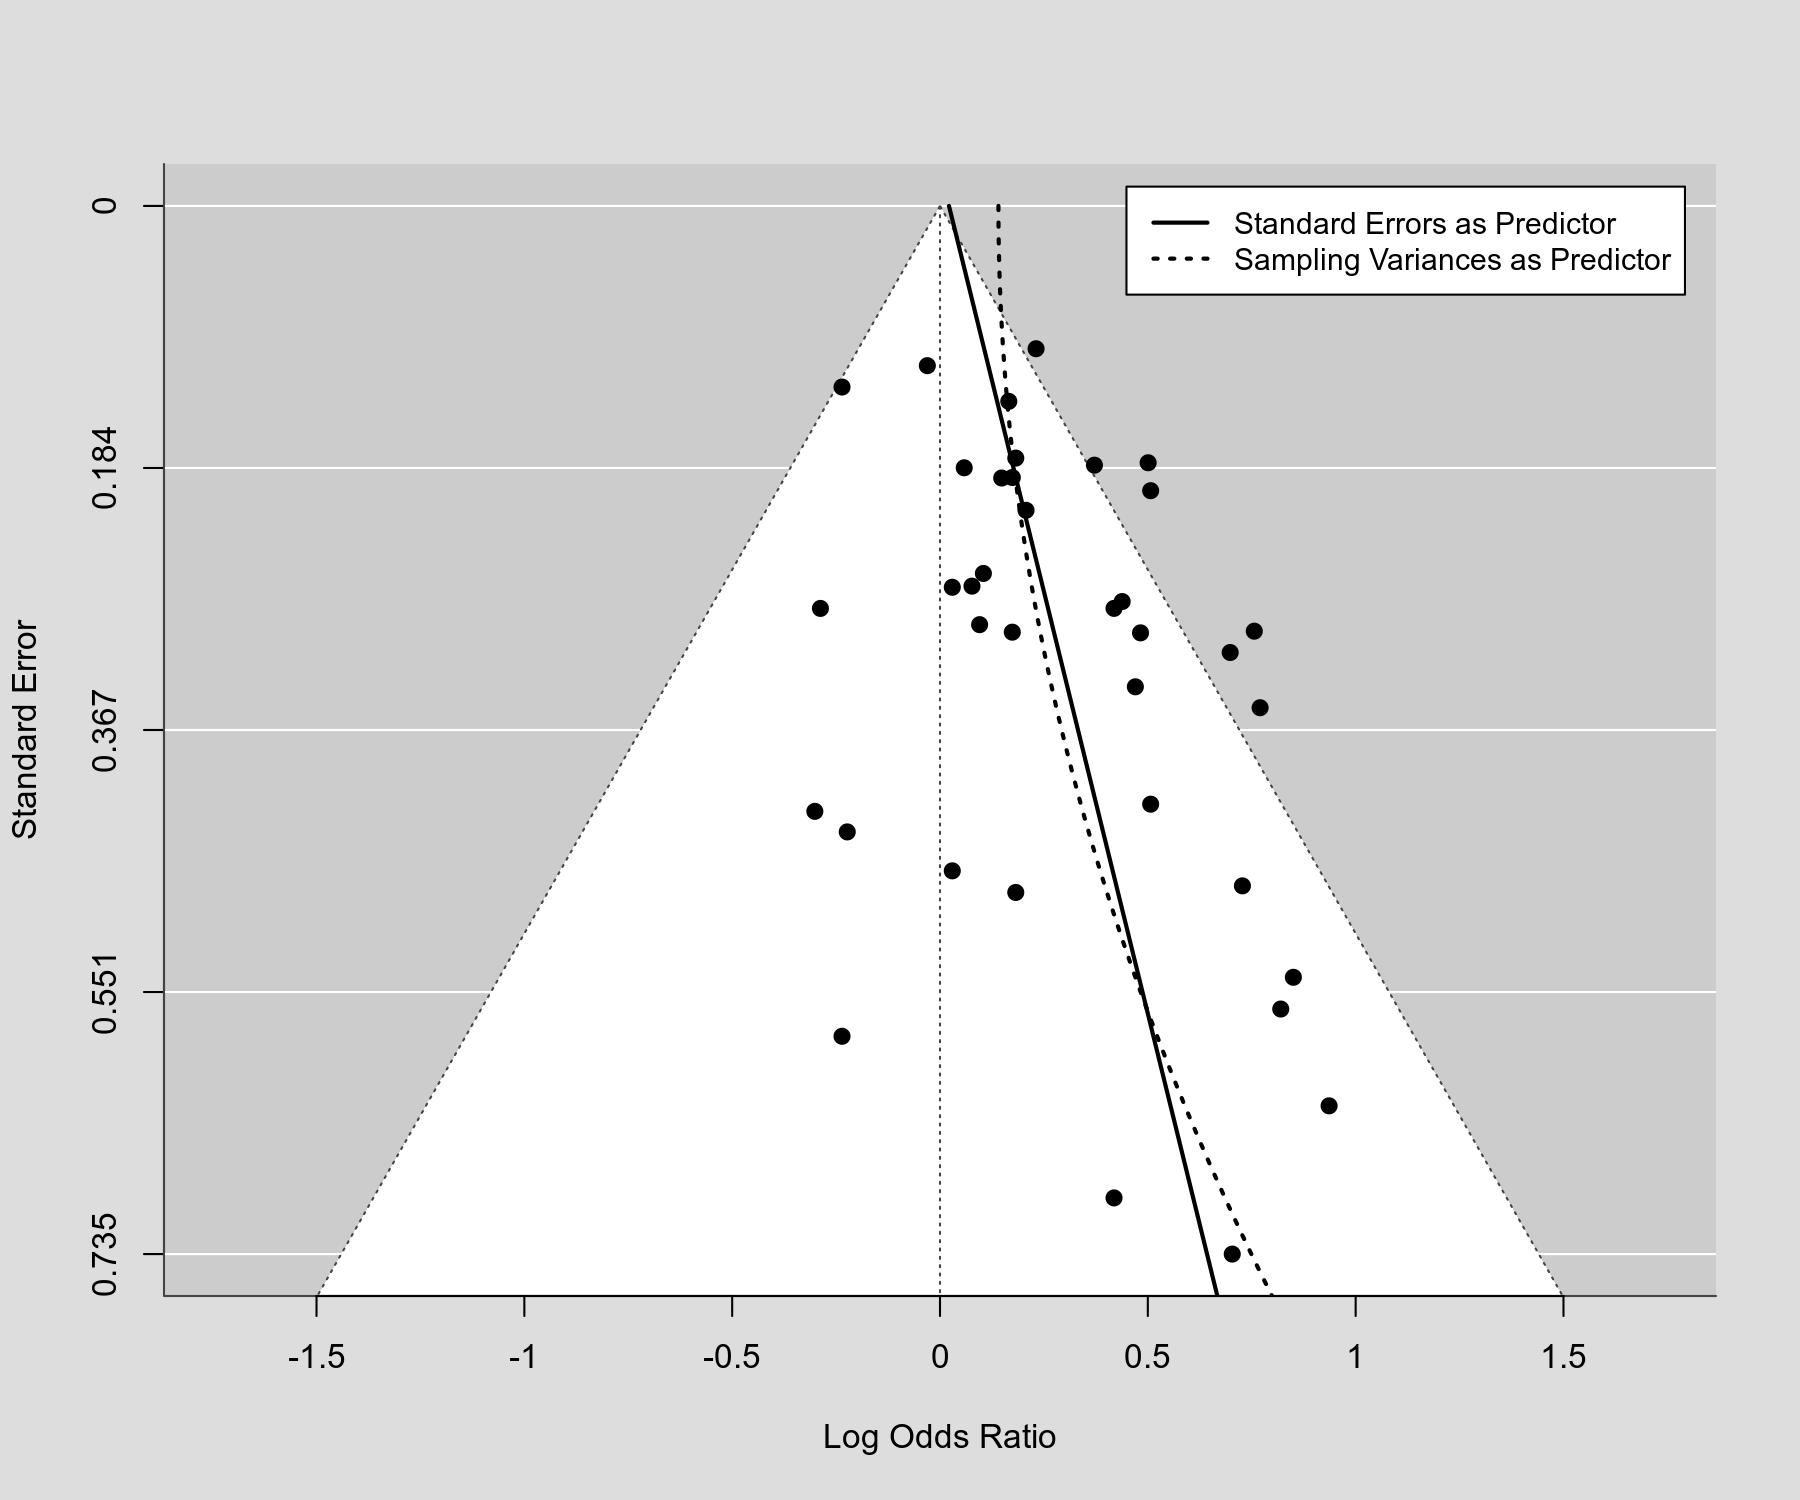
Based on the regression test for funnel plot asymmetry, one can obtain a 'limit estimate' of the (average) true effect. The underlying idea is quite simple: When the standard error, sampling variance, or inverse (square root) sample size is used as the predictor for the regression test, the intercept of the model underlying the regression test in essence reflects the estimate under infinite precision. This is sometimes (cautiously) interpreted as an estimate of the (average) true effect that is adjusted for publication bias. The plot below shows a standard funnel plot (with the standard error on the y-axis) with the regression lines underlying the regression test superimposed (once using the standard error and once using the sampling variance as predictor). The limit estimates are the predicted values for a standard error equal to 0.
Plot
Code
library(metafor)

### fit random-effects model
res <- rma(yi, vi, data=dat.hackshaw1998)

### funnel plot centered at 0
funnel(res, refline=0)

### regression test (by default using the standard error as predictor)
reg <- regtest(res)

### add regression line to funnel plot
se <- seq(0,0.8,length=100)
lines(coef(reg$fit)[1] + coef(reg$fit)[2]*se, se)

### regression test (using the sampling variance as predictor)
reg <- regtest(res, predictor="vi")

### add regression line to funnel plot (using the sampling variance as predictor)
lines(coef(reg$fit)[1] + coef(reg$fit)[2]*se^2, se)