Table of Contents
Forest Plot with Superscripts
Description
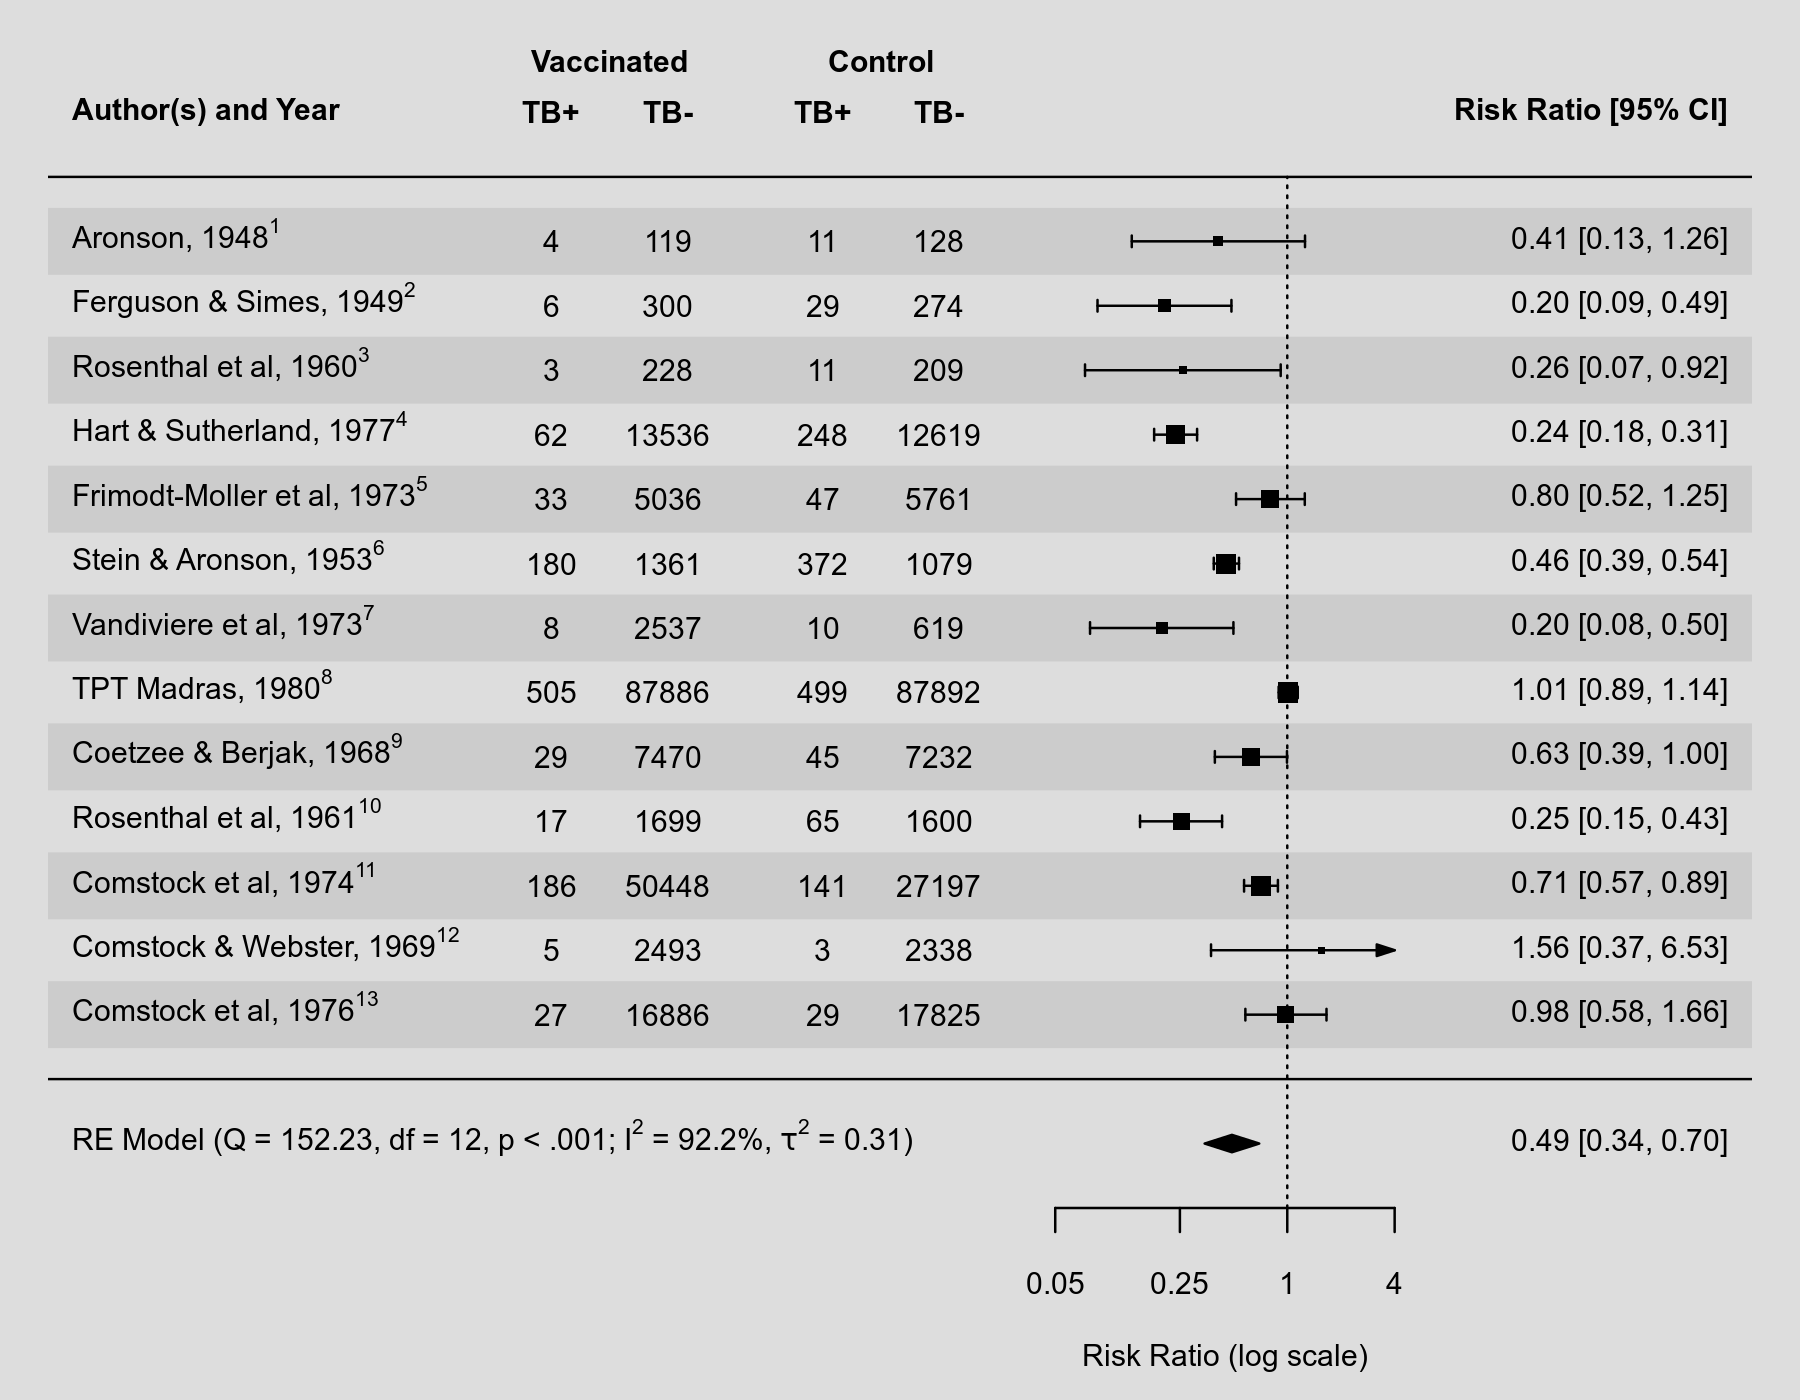
Some journals require reference numbers to be shown in forest plots (in addition to the study authors and publication years). Typically, the reference numbers are supposed to be shown as superscripts. How to accomplish this with R and the metafor package has occasionally been asked. Text involving superscripts can be added to plots using 'expressions', which are more generally used to add mathematical equations to plots. See help(plotmath) for the syntax to create such mathematical expressions. An additional difficulty in the present context is that one typically wants to substitute variables (like the reference numbers) into these expressions. This can be accomplished in various ways using functions such as substitute() and bquote(). Below is an example to illustrate how this can be done to add reference numbers as superscripts and additional information from the random-effects model to a forest plot.
Plot
Code
### copy BCG vaccine meta-analysis data into 'dat'
dat <- dat.bcg

### calculate log risk ratios and corresponding sampling variances
dat <- escalc(measure="RR", ai=tpos, bi=tneg, ci=cpos, di=cneg, data=dat)

### create study labels
dat$slab <- with(dat, paste(author, year, sep=", "))

### combine study labels with trial numbers in superscripts
dat$slab.ref <- mapply(function(x,y) as.expression(bquote(.(x)^.(y))), dat$slab, dat$trial)

### fit random-effects model
res <- rma(yi, vi, data=dat)

### a little helper function to add Q-test, I^2, and tau^2 estimate info
mlabfun <- function(text, x) {
   list(bquote(paste(.(text),
      " (Q = ", .(fmtx(x$QE, digits=2)),
      ", df = ", .(x$k - x$p), ", ",
      .(fmtp2(x$QEp)), "; ",
      I^2, " = ", .(fmtx(x$I2, digits=1)), "%, ",
      tau^2, " = ", .(fmtx(x$tau2, digits=2)), ")")))}

### forest plot with extra annotations
forest(res, atransf=exp, at=log(c(0.05, 0.25, 1, 4)), xlim=c(-16,6),
       ilab=cbind(tpos, tneg, cpos, cneg), ilab.lab=c("TB+","TB-","TB+","TB-"),
       ilab.xpos=c(-9.5,-8,-6,-4.5), cex=0.75, header="Author(s) and Year",
       mlab=mlabfun("RE Model", res), slab=slab.ref, shade=TRUE)
text(c(-8.75,-5.25), res$k+2.8, c("Vaccinated", "Control"), cex=0.75, font=2)