plots:forest_plot
This is an old revision of the document!
Table of Contents
Forest Plot
Description
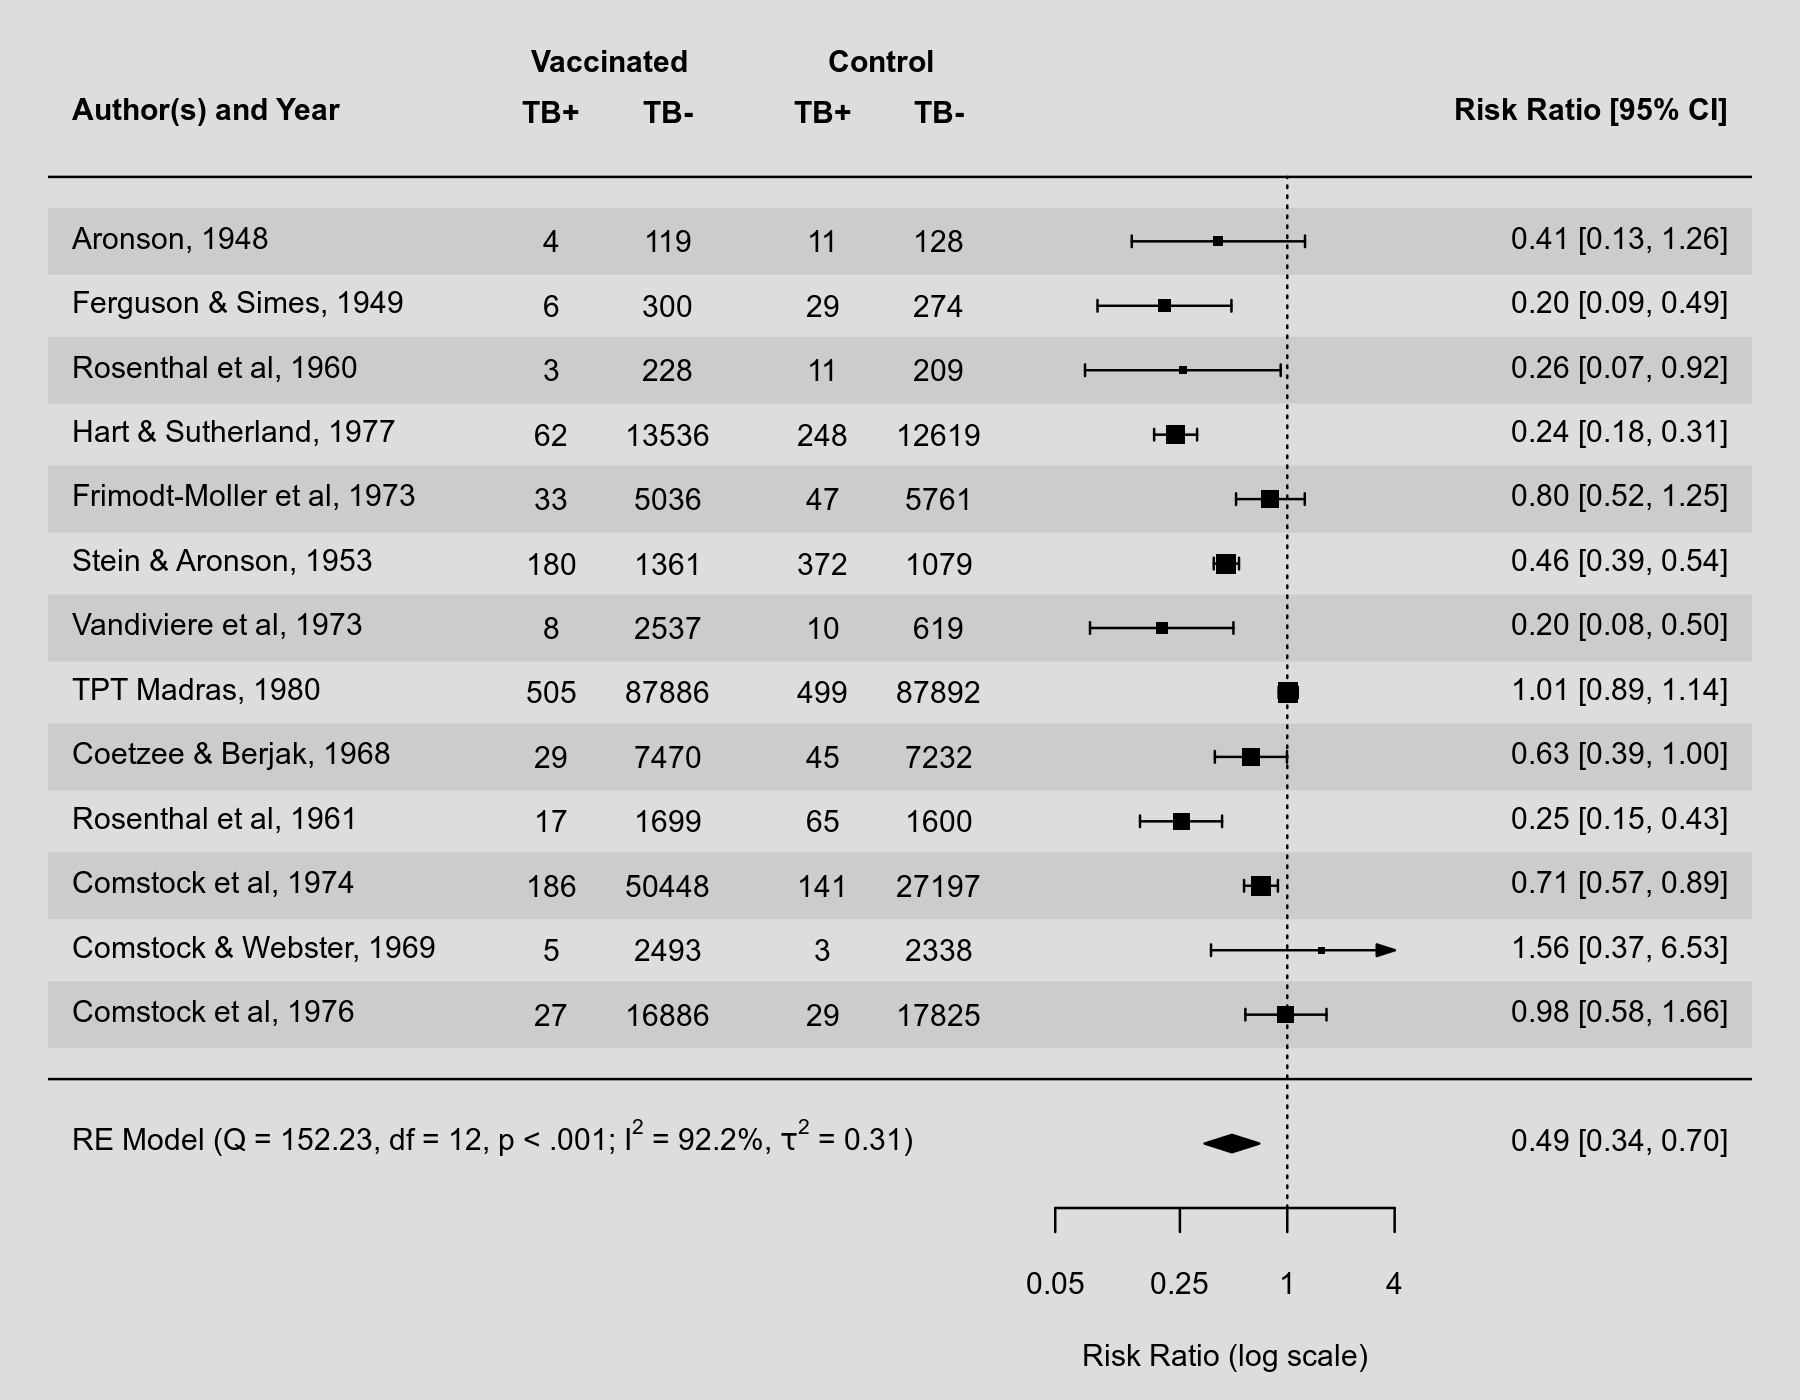
A forest plot is a commonly used visualization technique in meta-analyses, showing the results of the individual studies (i.e., the estimated effects or observed outcomes) together with their (usually 95%) confidence intervals. A four-sided polygon, sometimes called a summary 'diamond', is added to the bottom of the plot, showing the summary estimate based on the model (with the center of the polygon corresponding to the estimate and the left/right edges indicating the confidence interval limits). Below is an example of such a forest plot.
Plot
Code
library(metafor)

### copy BCG vaccine meta-analysis data into 'dat'
dat <- dat.bcg

### calculate log risk ratios and corresponding sampling variances (and use
### the 'slab' argument to store study labels as part of the data frame)
dat <- escalc(measure="RR", ai=tpos, bi=tneg, ci=cpos, di=cneg, data=dat,
              slab=paste(author, year, sep=", "))

### fit random-effects model
res <- rma(yi, vi, data=dat)

### forest plot with extra annotations
forest(res, atransf=exp, at=log(c(.05, .25, 1, 4)), xlim=c(-16,6),
       ilab=cbind(dat.bcg$tpos, dat.bcg$tneg, dat.bcg$cpos, dat.bcg$cneg),
       ilab.xpos=c(-9.5,-8,-6,-4.5), cex=.75, header="Author(s) and Year",
       mlab="")
op <- par(cex=.75, font=2)
text(c(-9.5,-8,-6,-4.5), 15, c("TB+", "TB-", "TB+", "TB-"))
text(c(-8.75,-5.25),     16, c("Vaccinated", "Control"))
par(op)

### add text with Q-value, dfs, p-value, and I^2 statistic
text(-16, -1, pos=4, cex=0.75, bquote(paste("RE Model (Q = ",
     .(formatC(res$QE, digits=2, format="f")), ", df = ", .(res$k - res$p),
     ", p = ", .(formatC(res$QEp, digits=2, format="f")), "; ", I^2, " = ",
     .(formatC(res$I2, digits=1, format="f")), "%)")))
plots/forest_plot.1594714568.txt.gz · Last modified: 2020/07/14 08:16 by Wolfgang Viechtbauer