metafor
Media Manager


Media Files
Files in plots

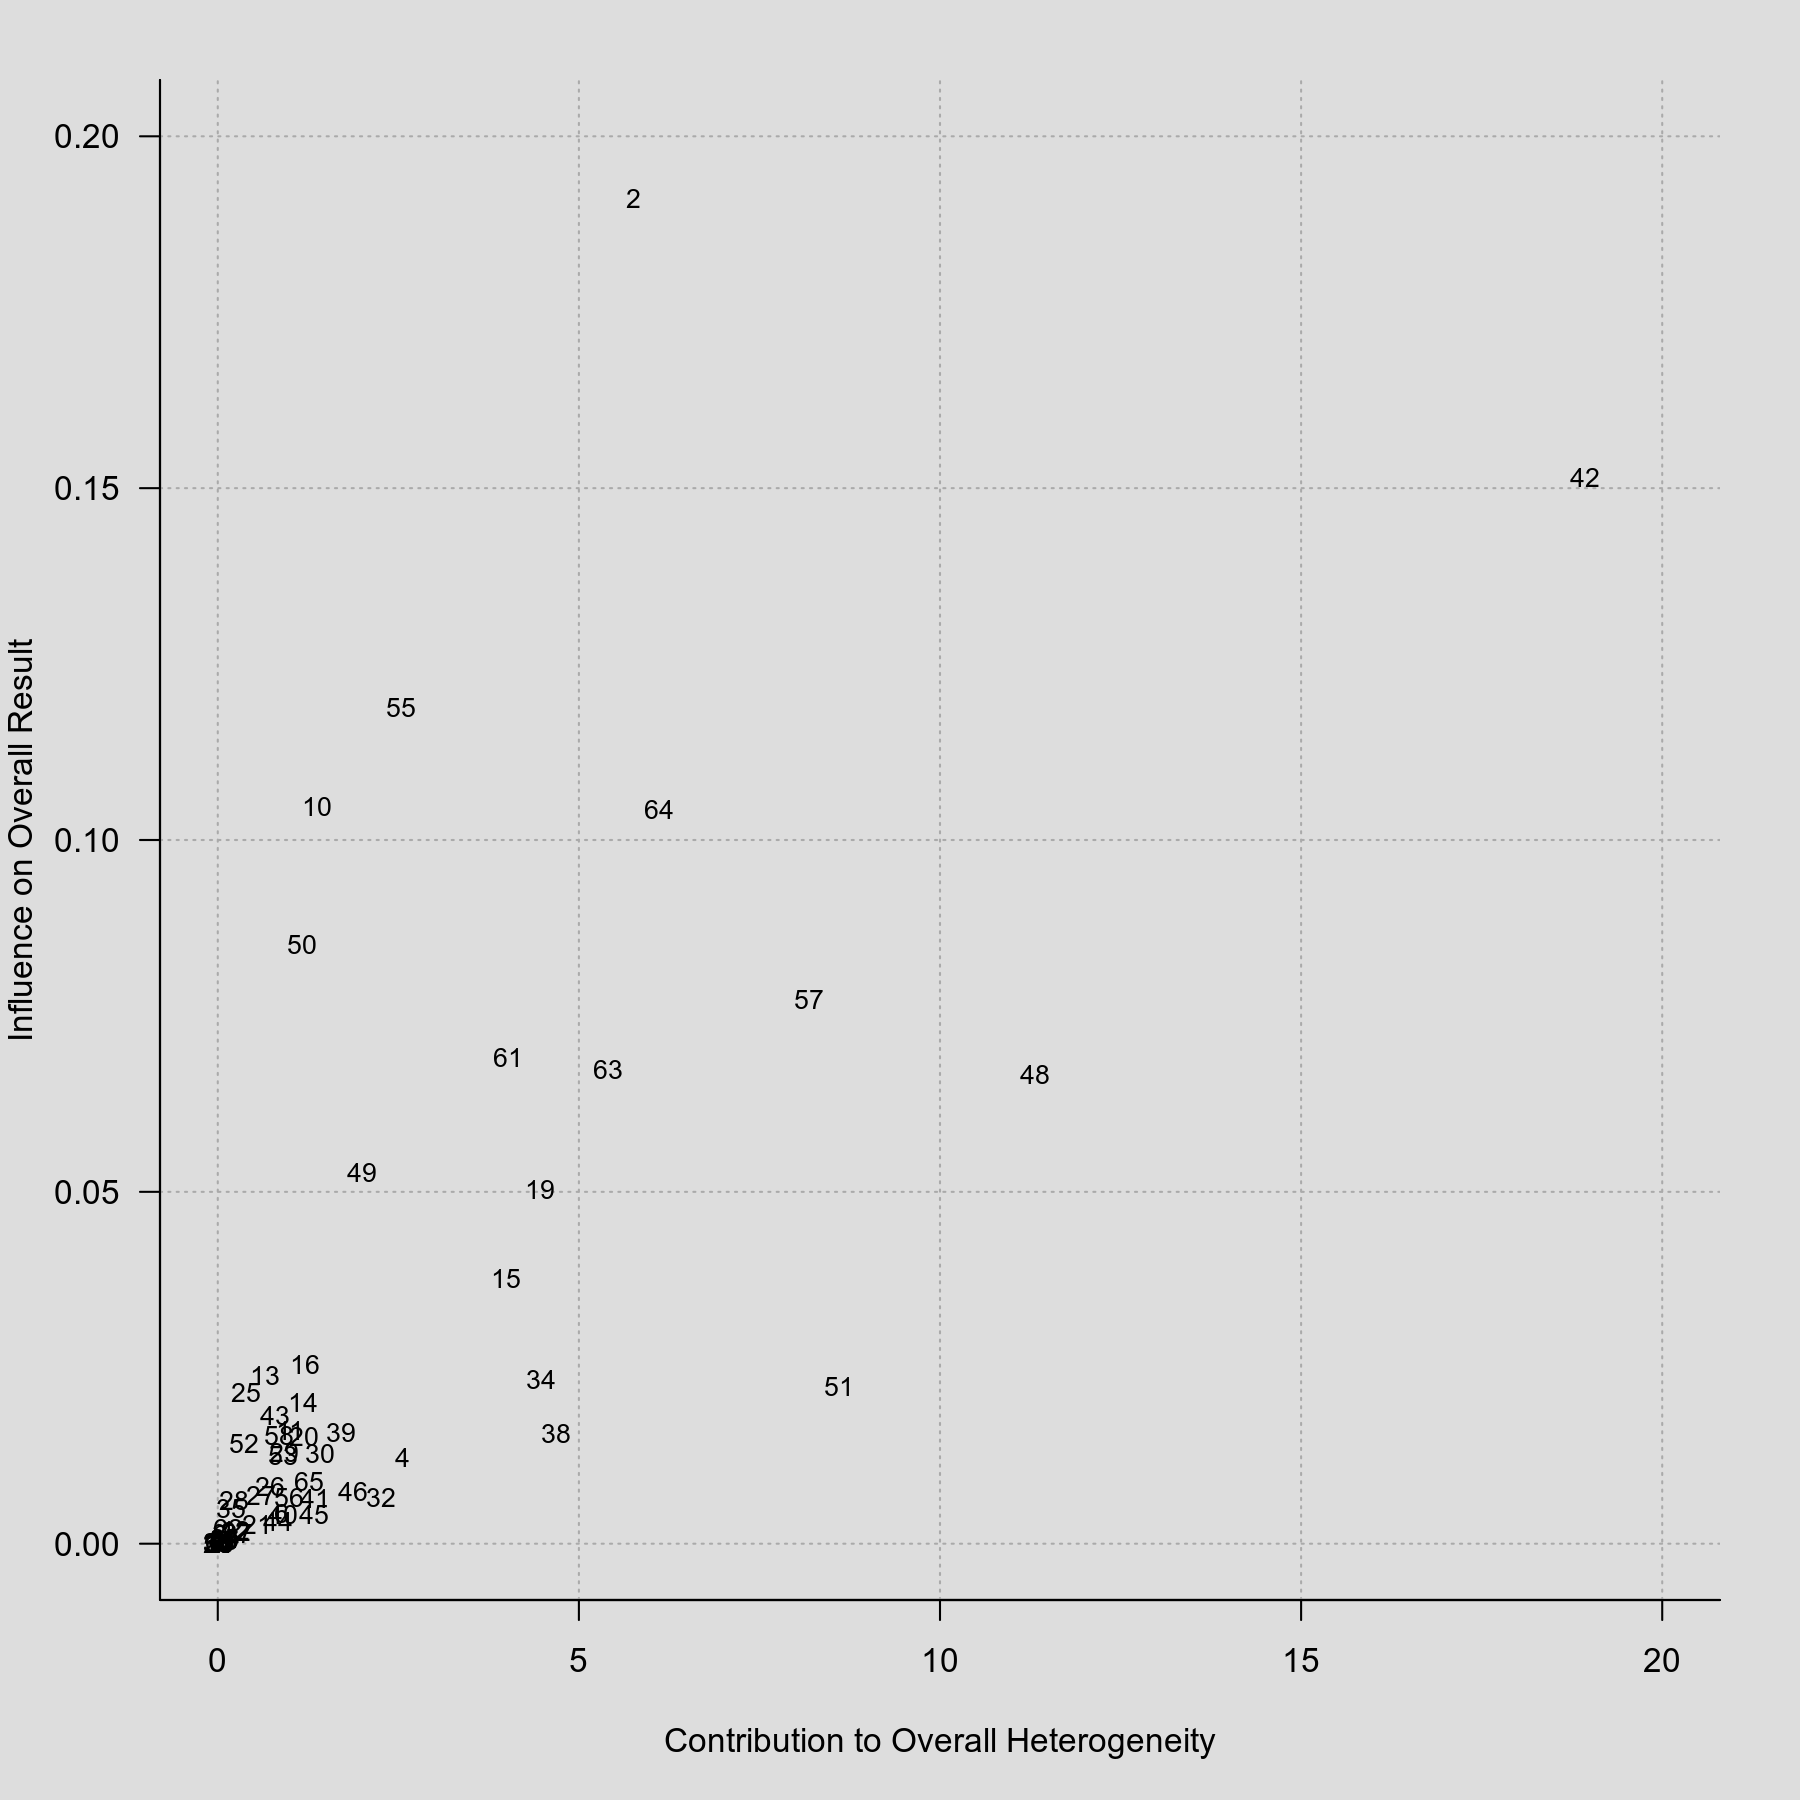
- baujat_plot.png
- 1800×1800
- 2023/10/22 13:43
- 46.9 KB

- caterpillar_plot.png
- 1800×1500
- 2023/08/19 14:40
- 29.8 KB

- contour_enhanced_funnel_plot_2.png
- 1800×1500
- 2024/04/16 12:27
- 28.1 KB

- contour_enhanced_funnel_plot.png
- 1800×1500
- 2024/04/16 12:27
- 57 KB

- cumulative_forest_plot.png
- 1800×1400
- 2023/08/19 14:40
- 67 KB

- forest_plot_bmj_orig.png
- 3312×1228
- 2022/03/15 22:36
- 107.8 KB

- forest_plot_bmj.png
- 3312×1228
- 2023/08/22 11:52
- 94.8 KB

- forest_plot_revman_orig.png
- 3196×1648
- 2022/03/20 16:39
- 202.2 KB

- forest_plot_revman.png
- 3196×1648
- 2023/08/22 11:35
- 151.1 KB

- forest_plot_with_multiple_cis.png
- 1800×1400
- 2023/08/19 14:36
- 78.5 KB

- forest_plot_with_subgroups.png
- 1800×1800
- 2023/09/21 19:07
- 107.5 KB

- forest_plot_with_superscripts.png
- 1800×1400
- 2023/09/21 19:02
- 79 KB

- forest_plot_with_textpos.png
- 1800×1400
- 2023/09/21 19:11
- 76.4 KB

- forest_plot.png
- 1800×1400
- 2023/09/21 18:58
- 76.8 KB

- funnel_plot_variations.png
- 1800×1800
- 2023/08/19 14:05
- 78.7 KB

- funnel_plot_with_limit_estimate.png
- 1800×1500
- 2023/08/19 14:16
- 49.9 KB

- funnel_plot_with_trim_and_fill.png
- 1800×1500
- 2023/08/29 19:23
- 44.4 KB

- gosh_plot.png
- 1800×1800
- 2023/08/19 14:51
- 109.9 KB

- labbe_plot.png
- 1800×1600
- 2024/04/18 13:55
- 110.6 KB

- meta_analytic_scatterplot.png
- 1800×1500
- 2023/08/19 14:46
- 39.4 KB

- normal_qq_plots.png
- 1800×1800
- 2023/08/19 14:55
- 64.1 KB

- plot_of_cumulative_results.png
- 1800×1600
- 2023/08/19 14:54
- 53.9 KB

- plot_of_influence_diagnostics.png
- 1800×3600
- 2023/08/19 14:53
- 294.6 KB

- radial_plot.png
- 1800×1800
- 2023/08/19 14:50
- 35 KB


![[root]](/doku.php/metafor?ns=&tab_files=files&do=media&tab_details=view&image=plots%3Abaujat_plot.png)
File
- View

- Date:
- 2023/10/22 13:43
- Filename:
- baujat_plot.png
- Format:
- PNG
- Size:
- 47KB
- Width:
- 1800
- Height:
- 1800
- References for:
- Baujat Plot
metafor.txt · Last modified: 2021/11/06 12:18 by Wolfgang Viechtbauer