Table of Contents
Konstantopoulos (2011)
The Methods and Data
Konstantopoulos (2011) describes a three-level meta-analytic model that is applicable when multiple effect size estimates are nested within a higher level grouping variable (e.g., paper, lab, research group, species). One would then expect the underlying true effects to be more similar for the same level of the grouping variable than true effects arising from different levels (i.e., the true effects within the same level may be correlated). We can account for the correlation in the true effects by adding a random effect to the model at the level corresponding to the grouping variable.
In the paper, the use of such a multilevel model is illustrated based on a meta-analysis of studies examining the effects of modified school calendars on student achievement (Cooper et al., 2003). In particular, instead of following the more traditional school calendar with a long summer break (in addition to a short winter and spring break), some schools have switched to a modified school calendar comprising more frequent but shorter intermittent breaks (e.g., 9 weeks of school followed by 3 weeks off), while keeping the total number of days at school approximately the same.
The dataset (taken from Konstantopoulos, 2011) contains the results from 56 studies, each comparing the level of academic achievement in a group of students following a modified school calendar with that of a group of students following a more traditional school calendar. The difference between the two groups was quantified in terms of a standardized mean difference (with positive values indicating a higher mean level of achievement in the group following the modified school calendar).
The studies were conducted at various schools that were clustered within districts. The data therefore have a multilevel structure, with studies nested within districts. A multilevel meta-analysis of these data can be used to estimate and account for the amount of heterogeneity between districts and between schools within districts.
The data (provided in Table 1 of the paper) can be loaded with:
library(metafor)
dat <- dat.konstantopoulos2011
(I copy the dataset into dat, which is a bit shorter and therefore easier to type further below). Let's examine the first 15 rows of the dataset:
head(dat, 15)
   district school study year     yi    vi
1        11      1     1 1976 -0.180 0.118
2        11      2     2 1976 -0.220 0.118
3        11      3     3 1976  0.230 0.144
4        11      4     4 1976 -0.300 0.144
5        12      1     5 1989  0.130 0.014
6        12      2     6 1989 -0.260 0.014
7        12      3     7 1989  0.190 0.015
8        12      4     8 1989  0.320 0.024
9        18      1     9 1994  0.450 0.023
10       18      2    10 1994  0.380 0.043
11       18      3    11 1994  0.290 0.012
12       27      1    12 1976  0.160 0.020
13       27      2    13 1976  0.650 0.004
14       27      3    14 1976  0.360 0.004
15       27      4    15 1976  0.600 0.007
So, 4 studies were conducted in district 11, 4 studies in district 12, 3 studies in district 18, and so on. Variables yi and vi are the standardized mean differences and corresponding sampling variances.
Descriptives
On page 69, some descriptive information about the dataset is provided. Let's first reproduce this information. The studies were conducted in various years, ranging from 1976 to 2000:
table(dat$year)
1976 1989 1994 1995 1997 2000
  19    4    5    2   15   11
The percentage of studies conducted in the various years can be obtained with:
100*round(proportions(table(dat$year)),2)
1976 1989 1994 1995 1997 2000
  34    7    9    4   27   20
We can obtain some descriptives about the effect size estimates with:
round(c(summary(dat$yi), SD=sd(dat$yi)), 2)
   Min. 1st Qu.  Median    Mean 3rd Qu.    Max.      SD
  -0.52   -0.05    0.04    0.12    0.28    1.19    0.33
To get a better sense of the data structure, we can examine how many studies were carried out in each of the 11 districts with:
table(dat$district)
 11  12  18  27  56  58  71  86  91 108 644
  4   4   3   4   4  11   3   8   6   5   4
So, as noted in the article, the data have an unbalanced structure, with the number of studies/schools per district ranging from 3 to 11 (range(table(dat$district))) with an average of 5.1 (round(mean(table(dat$district)), 1)).
To obtain the descriptives about the effect size estimates per district (Table 3 in the paper), we can use:
round(aggregate(yi ~ district, data=dat, FUN=function(x)
                c(mean=mean(x), sd=sd(x), min=min(x), max=max(x))), 3)
   district yi.mean  yi.sd yi.min yi.max
1        11  -0.118  0.237 -0.300  0.230
2        12   0.095  0.250 -0.260  0.320
3        18   0.373  0.080  0.290  0.450
4        27   0.442  0.227  0.160  0.650
5        56   0.062  0.103 -0.060  0.190
6        58  -0.077  0.126 -0.300  0.070
7        71   0.823  0.465  0.300  1.190
8        86  -0.029  0.042 -0.100  0.020
9        91   0.247  0.271  0.000  0.660
10      108   0.016  0.487 -0.520  0.700
11      644   0.180  0.295 -0.050  0.610
Two-Level Model
First, a standard (two-level) random-effects model is fitted to the data. Here, we treat the 56 studies as independent (which we later will see is not justified). We can fit such a model with:
res <- rma(yi, vi, data=dat)
print(res, digits=3)
Random-Effects Model (k = 56; tau^2 estimator: REML)

tau^2 (estimated amount of total heterogeneity): 0.088 (SE = 0.020)
tau (square root of estimated tau^2 value):      0.297
I^2 (total heterogeneity / total variability):   94.70%
H^2 (total variability / sampling variability):  18.89

Test for Heterogeneity:
Q(df = 55) = 578.864, p-val < .001

Model Results:

estimate     se   zval   pval  ci.lb  ci.ub
   0.128  0.044  2.916  0.004  0.042  0.214  **

---
Signif. codes:  0 ‘***’ 0.001 ‘**’ 0.01 ‘*’ 0.05 ‘.’ 0.1 ‘ ’ 1
These results correspond to those given on the left-hand side of Table 4. The CI for $\tau^2$ given in the paper (i.e., $0.059–0.146$) is based on a Satterthwaite approximation. A CI for $\tau^2$ based on the Q-profile method can be obtained with:
confint(res, digits=3)
       estimate  ci.lb  ci.ub
tau^2     0.088  0.056  0.139
tau       0.297  0.238  0.373
I^2(%)   94.705 91.946 96.560
H^2      18.885 12.416 29.072
The results from the mixed-effects meta-regression model including the study year as a potential moderator/covariate can be reproduced with:
res <- rma(yi, vi, mods = ~ I(year-mean(year)), data=dat)
Mixed-Effects Model (k = 56; tau^2 estimator: REML)

tau^2 (estimated amount of residual heterogeneity):     0.089 (SE = 0.020)
tau (square root of estimated tau^2 value):             0.298
I^2 (residual heterogeneity / unaccounted variability): 94.71%
H^2 (unaccounted variability / sampling variability):   18.89
R^2 (amount of heterogeneity accounted for):            0.00%

Test for Residual Heterogeneity:
QE(df = 54) = 550.260, p-val < .001

Test of Moderators (coefficient 2):
QM(df = 1) = 1.383, p-val = 0.240

Model Results:

                      estimate     se   zval   pval   ci.lb  ci.ub
intrcpt                  0.126  0.044  2.859  0.004   0.040  0.212  **
I(year - mean(year))     0.005  0.004  1.176  0.240  -0.003  0.014

---
Signif. codes:  0 ‘***’ 0.001 ‘**’ 0.01 ‘*’ 0.05 ‘.’ 0.1 ‘ ’ 1
The corresponding results can be found on the right-hand side of Table 4. Note that the year variable was entered in mean centered form in the model. Again, a CI for $\tau^2$ can be obtained with confint(res, digits=3) (output not shown).
We could also fit the same two-level random/mixed-effects models with the rma.mv() function. The syntax for the random-effects model would be:
res <- rma.mv(yi, vi, random = ~ 1 | study, data=dat)
print(res, digits=3)
Multivariate Meta-Analysis Model (k = 56; method: REML)

Variance Components:

           estim   sqrt  nlvls  fixed  factor
sigma^2    0.088  0.297     56     no   study

Test for Heterogeneity:
Q(df = 55) = 578.864, p-val < .001

Model Results:

estimate     se   zval   pval  ci.lb  ci.ub
   0.128  0.044  2.916  0.004  0.042  0.214  **

---
Signif. codes:  0 ‘***’ 0.001 ‘**’ 0.01 ‘*’ 0.05 ‘.’ 0.1 ‘ ’ 1
The random = ~ 1 | study argument adds random effects corresponding to the study level to the model (which is a unique value for every row in the dataset, so we are essentially adding random effects for every estimate to the model). Note that these are the same results as we obtained earlier. As before, moderators/covariates can be added to the model via the mods argument.
Three-Level Model
Let's move on now to the three-level model. Here, we want to add random effects not only at the study level, but also at the district level. The appropriate syntax for this is:
res.ml <- rma.mv(yi, vi, random = ~ 1 | district/study, data=dat)
print(res.ml, digits=3)
Multivariate Meta-Analysis Model (k = 56; method: REML)

Variance Components:

           estim   sqrt  nlvls  fixed          factor
sigma^2.1  0.065  0.255     11     no        district
sigma^2.2  0.033  0.181     56     no  district/study

Test for Heterogeneity:
Q(df = 55) = 578.864, p-val < .001

Model Results:

estimate     se   zval   pval  ci.lb  ci.ub
   0.185  0.085  2.185  0.029  0.019  0.350  *

---
Signif. codes:  0 ‘***’ 0.001 ‘**’ 0.01 ‘*’ 0.05 ‘.’ 0.1 ‘ ’ 1
These results correspond to those given on the left-hand side of Table 5 in the paper. Somewhat confusingly, the results given in the table appear to be based on ML (instead of REML) estimation. With the argument method="ML", we could reproduce the results given in the paper more closely.
Note: We would obtain the same results when using random = ~ 1 | district/school. While the school variable always starts at 1 within each district, using this notation means that random effects should be added for each level of district and for each level of school within each level of district. The latter is the same as adding random effects for every level of study, so the results will be identical.
Profile Likelihood Plots
Whenever we start fitting more complicated models with the rma.mv() function, it is a good idea to check the profile likelihood plots of the variance components of the model. The profile() function can be used to obtain such plots. Here, the model includes two variance components, which are denoted as $\sigma^2_1$ (for between-district heterogeneity) and $\sigma^2_2$ (for between-school-within-district heterogeneity). Likelihood profiles for these two components can be obtained with:
par(mfrow=c(2,1))
profile(res.ml, sigma2=1)
profile(res.ml, sigma2=2)
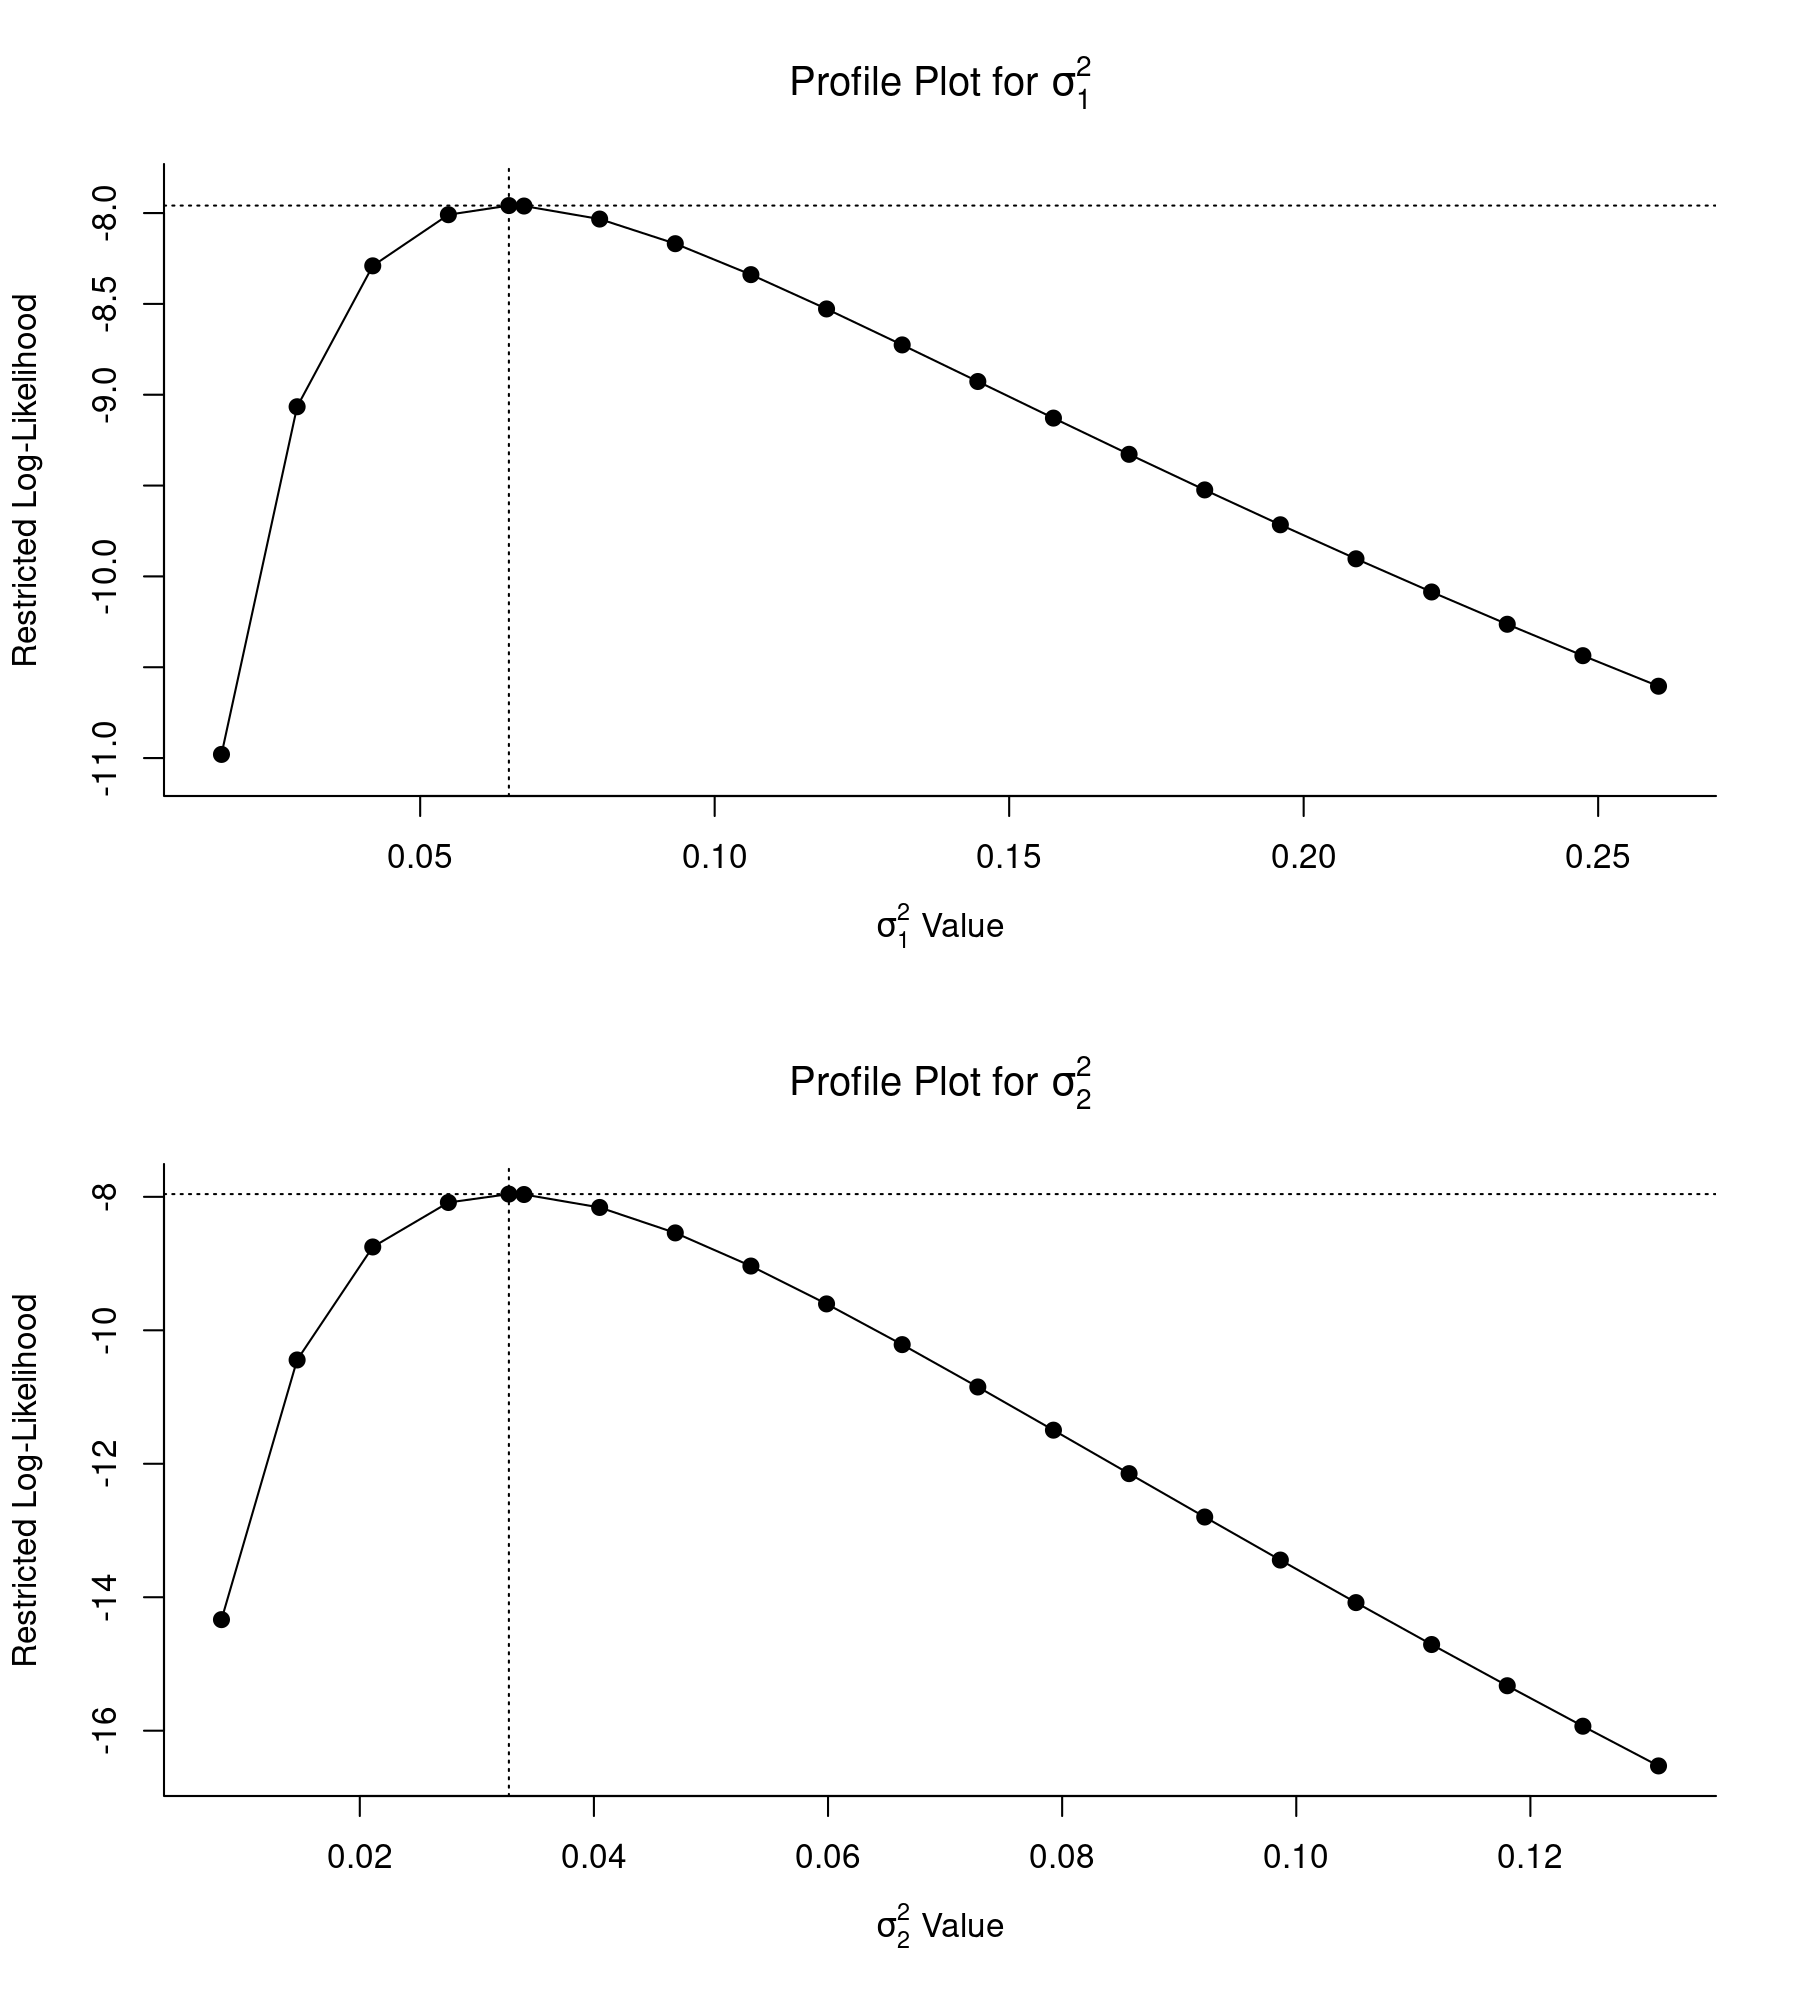
Both profile likelihood plots are peaked at the respective parameter estimates (as indicated by the vertical dotted lines) and the log likelihoods quickly decrease (i.e., become more negative) as the values of the components are moved away from the actual REML estimates. Hence, we can be fairly confident that both variance components are identifiable.
Intraclass Correlation of the True Effects
The three-level model used in the meta-analysis above allows for the underlying true effects within districts to be correlated. In fact, it can be shown that the model implies an intraclass correlation coefficient (ICC) of $$\rho = \frac{\sigma^2_1}{\sigma^2_1 + \sigma^2_2}$$ for true effects within the same level of the grouping variable (where $\sigma^2_1$ is the variance component corresponding to the grouping variable and $\sigma^2_2$ is the variance component corresponding to the level nested within the grouping variable).
In the present case, the ICC is estimated to be:
round(res.ml$sigma2[1] / sum(res.ml$sigma2), 3)
[1] 0.665
Therefore, the underlying true effects within districts are estimated to correlate quite strongly (the simpler two-level model we fitted at the beginning ignores this dependence).
Also, it is worth noting that the sum of the two variance components can be interpreted as the total amount of heterogeneity in the true effects:
round(sum(res.ml$sigma2), 3)
[1] 0.098
Multivariate Parameterization of the Model
We can fit the same model using a multivariate parameterization, which directly provides us with the ICC. For this, we use the syntax:
res.mv <- rma.mv(yi, vi, random = ~ study | district, data=dat)
print(res.mv, digits=3)
Multivariate Meta-Analysis Model (k = 56; method: REML)

Variance Components:

outer factor: district (nlvls = 11)
inner factor: study    (nlvls = 56)

           estim   sqrt  fixed
tau^2      0.098  0.313     no
rho        0.665            no

Test for Heterogeneity:
Q(df = 55) = 578.864, p-val < .001

Model Results:

estimate     se   zval   pval  ci.lb  ci.ub
   0.185  0.085  2.185  0.029  0.019  0.350  *

---
Signif. codes:  0 ‘***’ 0.001 ‘**’ 0.01 ‘*’ 0.05 ‘.’ 0.1 ‘ ’ 1
The random = ~ study | district argument adds correlated random effects for the different studies within districts to the model, where the variance-covariance matrix of the random effects takes on a compound symmetric structure (struct="CS" is the default). Note that the estimate of $\rho$ that is obtained is exactly the same as the ICC value we computed earlier based on the multilevel model. Also, the estimate of $\tau^2$ obtained from the multivariate parameterization is the same as the total amount of heterogeneity computed earlier based on the multilevel model. Note that random = ~ school | district would again yield the same results.
As long as $\rho$ is estimated to be positive, the multilevel and multivariate parameterizations are in essence identical. In fact, the log likelihoods of the two models should be identical, which we can confirm with:
logLik(res.ml)
logLik(res.mv)
'log Lik.' -7.958724 (df=3)
'log Lik.' -7.958724 (df=3)
Profile Likelihood Plots
Again, profile likelihood plots should be used to ensure the identifiability of the variance (and correlation) components when fitting complex meta-analytic models. In the multivariate model, there is one variance component, denoted as $\tau^2$, and one correlation component, denoted as $\rho$. Profile likelihood plots for these two parameters can be obtained with:
par(mfrow=c(2,1))
profile(res.mv, tau2=1)
profile(res.mv, rho=1)
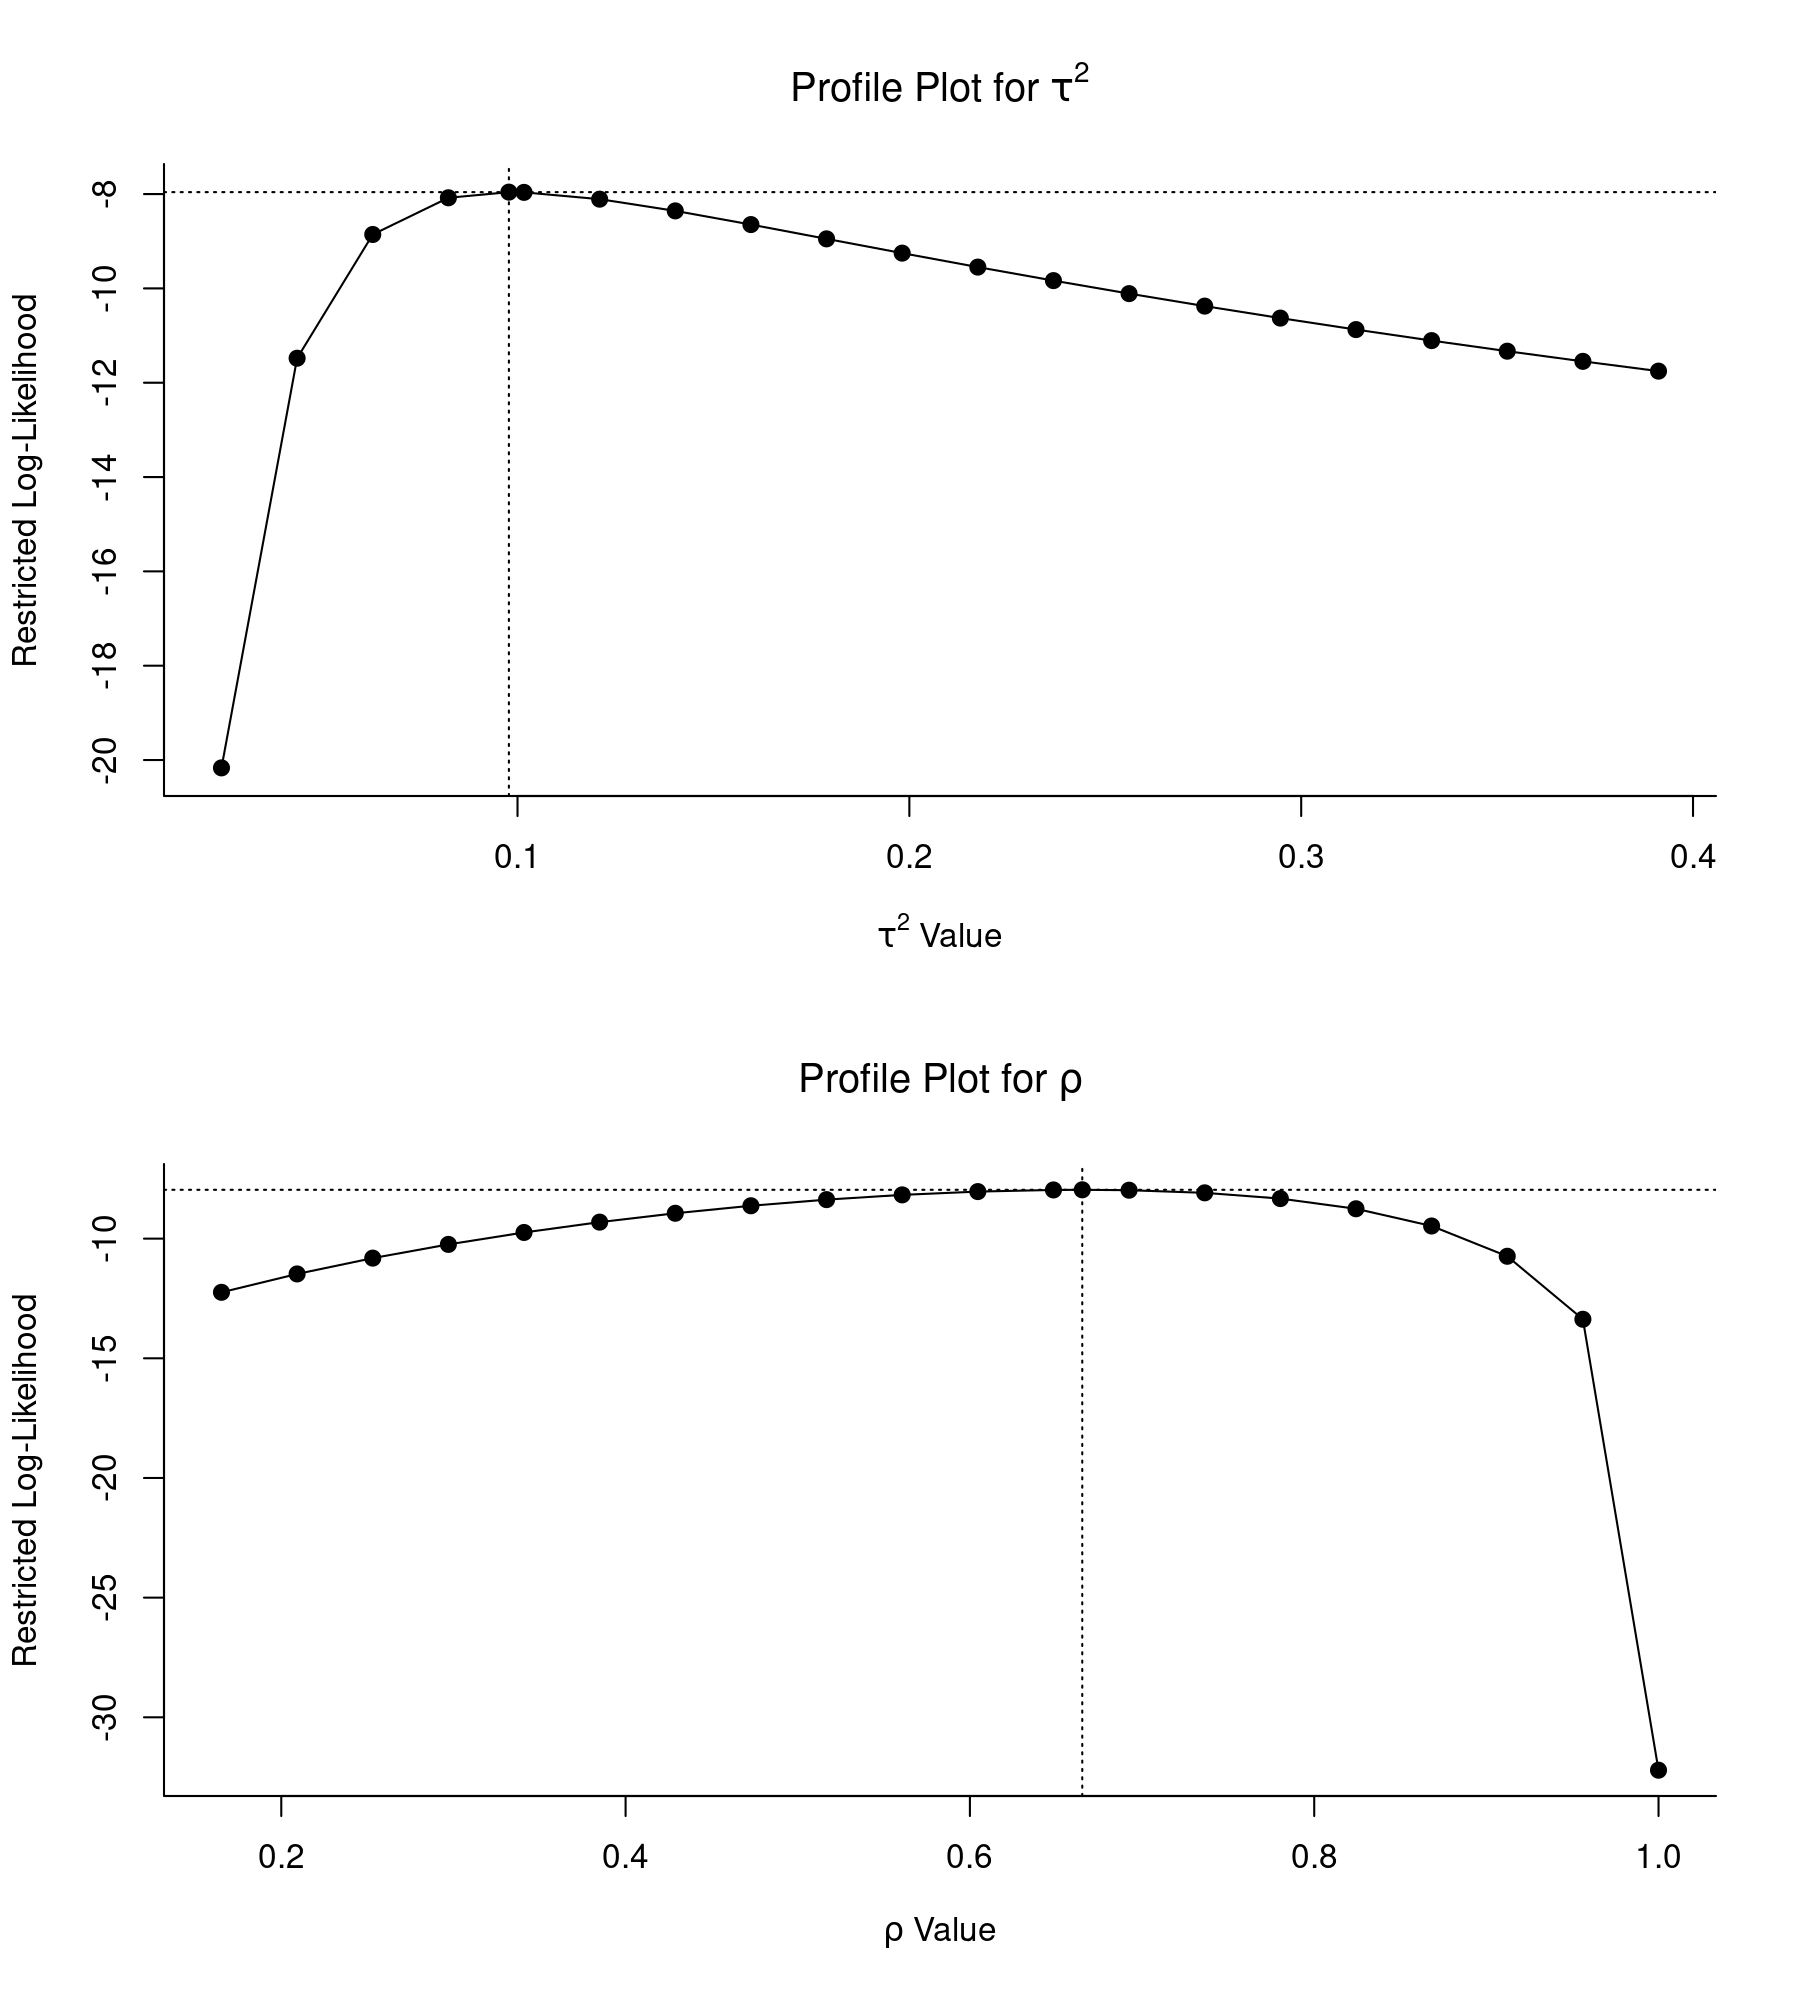
Again, both plots indicate that the estimates obtained in fact correspond to the peaks of the respective likelihood profiles, with decreasing log likelihoods as the values of parameters are moved away from the actual estimates.
Since the log likelihood drops of quite dramatically when $\rho$ is set equal to a value very close to 1, the left-hand side of the profile gets 'squished' together at the top and it is more difficult to see the curvature around the estimate. One can change the x-axis limits with the xlim argument. For example, with profile(res.mv, rho=1, xlim=c(0.3,0.9)) we can obtain a nicer profile plot for $\rho$.
Uncorrelated Sampling Errors
It is important to note that the models used above assume that the sampling errors of the effect size estimates are independent. This is typically an appropriate assumption as long as there is no overlap in the data/individuals used to compute the various estimates. However, when multiple estimates are obtained from the same group of individuals, then this assumption is most certainly violated. Similarly, when multiple treatment groups are contrasted against a common control group, then the reuse of the control group data automatically induces a correlation between the estimates. See Berkey et al. (1998) and Gleser & Olkin (2009) for examples involving correlated sampling errors.
A Common Mistake in the Three-Level Model
When fitting the three-level model, a common mistake is to forget to add random effects at both levels. In other words, one could fit the model:
rma.mv(yi, vi, random = ~ 1 | district, data=dat, digits=3)
Multivariate Meta-Analysis Model (k = 56; method: REML)

Variance Components:

           estim   sqrt  nlvls  fixed    factor
sigma^2    0.083  0.288     11     no  district

Test for Heterogeneity:
Q(df = 55) = 578.864, p-val < .001

Model Results:

estimate     se   zval   pval  ci.lb  ci.ub
   0.196  0.090  2.179  0.029  0.020  0.372  *

---
Signif. codes:  0 ‘***’ 0.001 ‘**’ 0.01 ‘*’ 0.05 ‘.’ 0.1 ‘ ’ 1
This model only accounts for heterogeneity between districts, so it assumes that the true effects for different studies within the same district are all identical (or put differently, that the ICC is equal to 1). In the present case, the ICC in the three-level model is actually quite high, so the results are not dramatically different, but this may not be true in other applications.
Overparameterized Models
Finally, for illustration purposes, it is instructive to examine what can happen when we fit an overparameterized model. For example, suppose we combine the multilevel and multivariate structures above in a single model:
res.op <- rma.mv(yi, vi, random = list(~ study | district, ~ 1 | district, ~ 1 | study), data=dat)
print(res.op, digits=3)
Multivariate Meta-Analysis Model (k = 56; method: REML)

Variance Components:

           estim   sqrt  nlvls  fixed    factor
sigma^2.1  0.041  0.203     11     no  district
sigma^2.2  0.026  0.162     56     no     study

outer factor: district (nlvls = 11)
inner factor: study    (nlvls = 56)

           estim   sqrt  fixed
tau^2      0.030  0.174     no
rho        0.784            no

Test for Heterogeneity:
Q(df = 55) = 578.864, p-val < .001

Model Results:

estimate     se   zval   pval  ci.lb  ci.ub
   0.185  0.085  2.185  0.029  0.019  0.350  *

---
Signif. codes:  0 ‘***’ 0.001 ‘**’ 0.01 ‘*’ 0.05 ‘.’ 0.1 ‘ ’ 1
In essence, since the model is overparameterized, the estimates of the variance and correlation components are largely arbitrary. However, it is not obvious from the results above that this is the case. By examining the profile likelihood plots of the variance and correlation components, we can determine that we are in fact in trouble:
par(mfrow=c(2,2))
profile(res.op)
(all variance components and correlations are automatically profiled when passing the model object to the profile() function.)
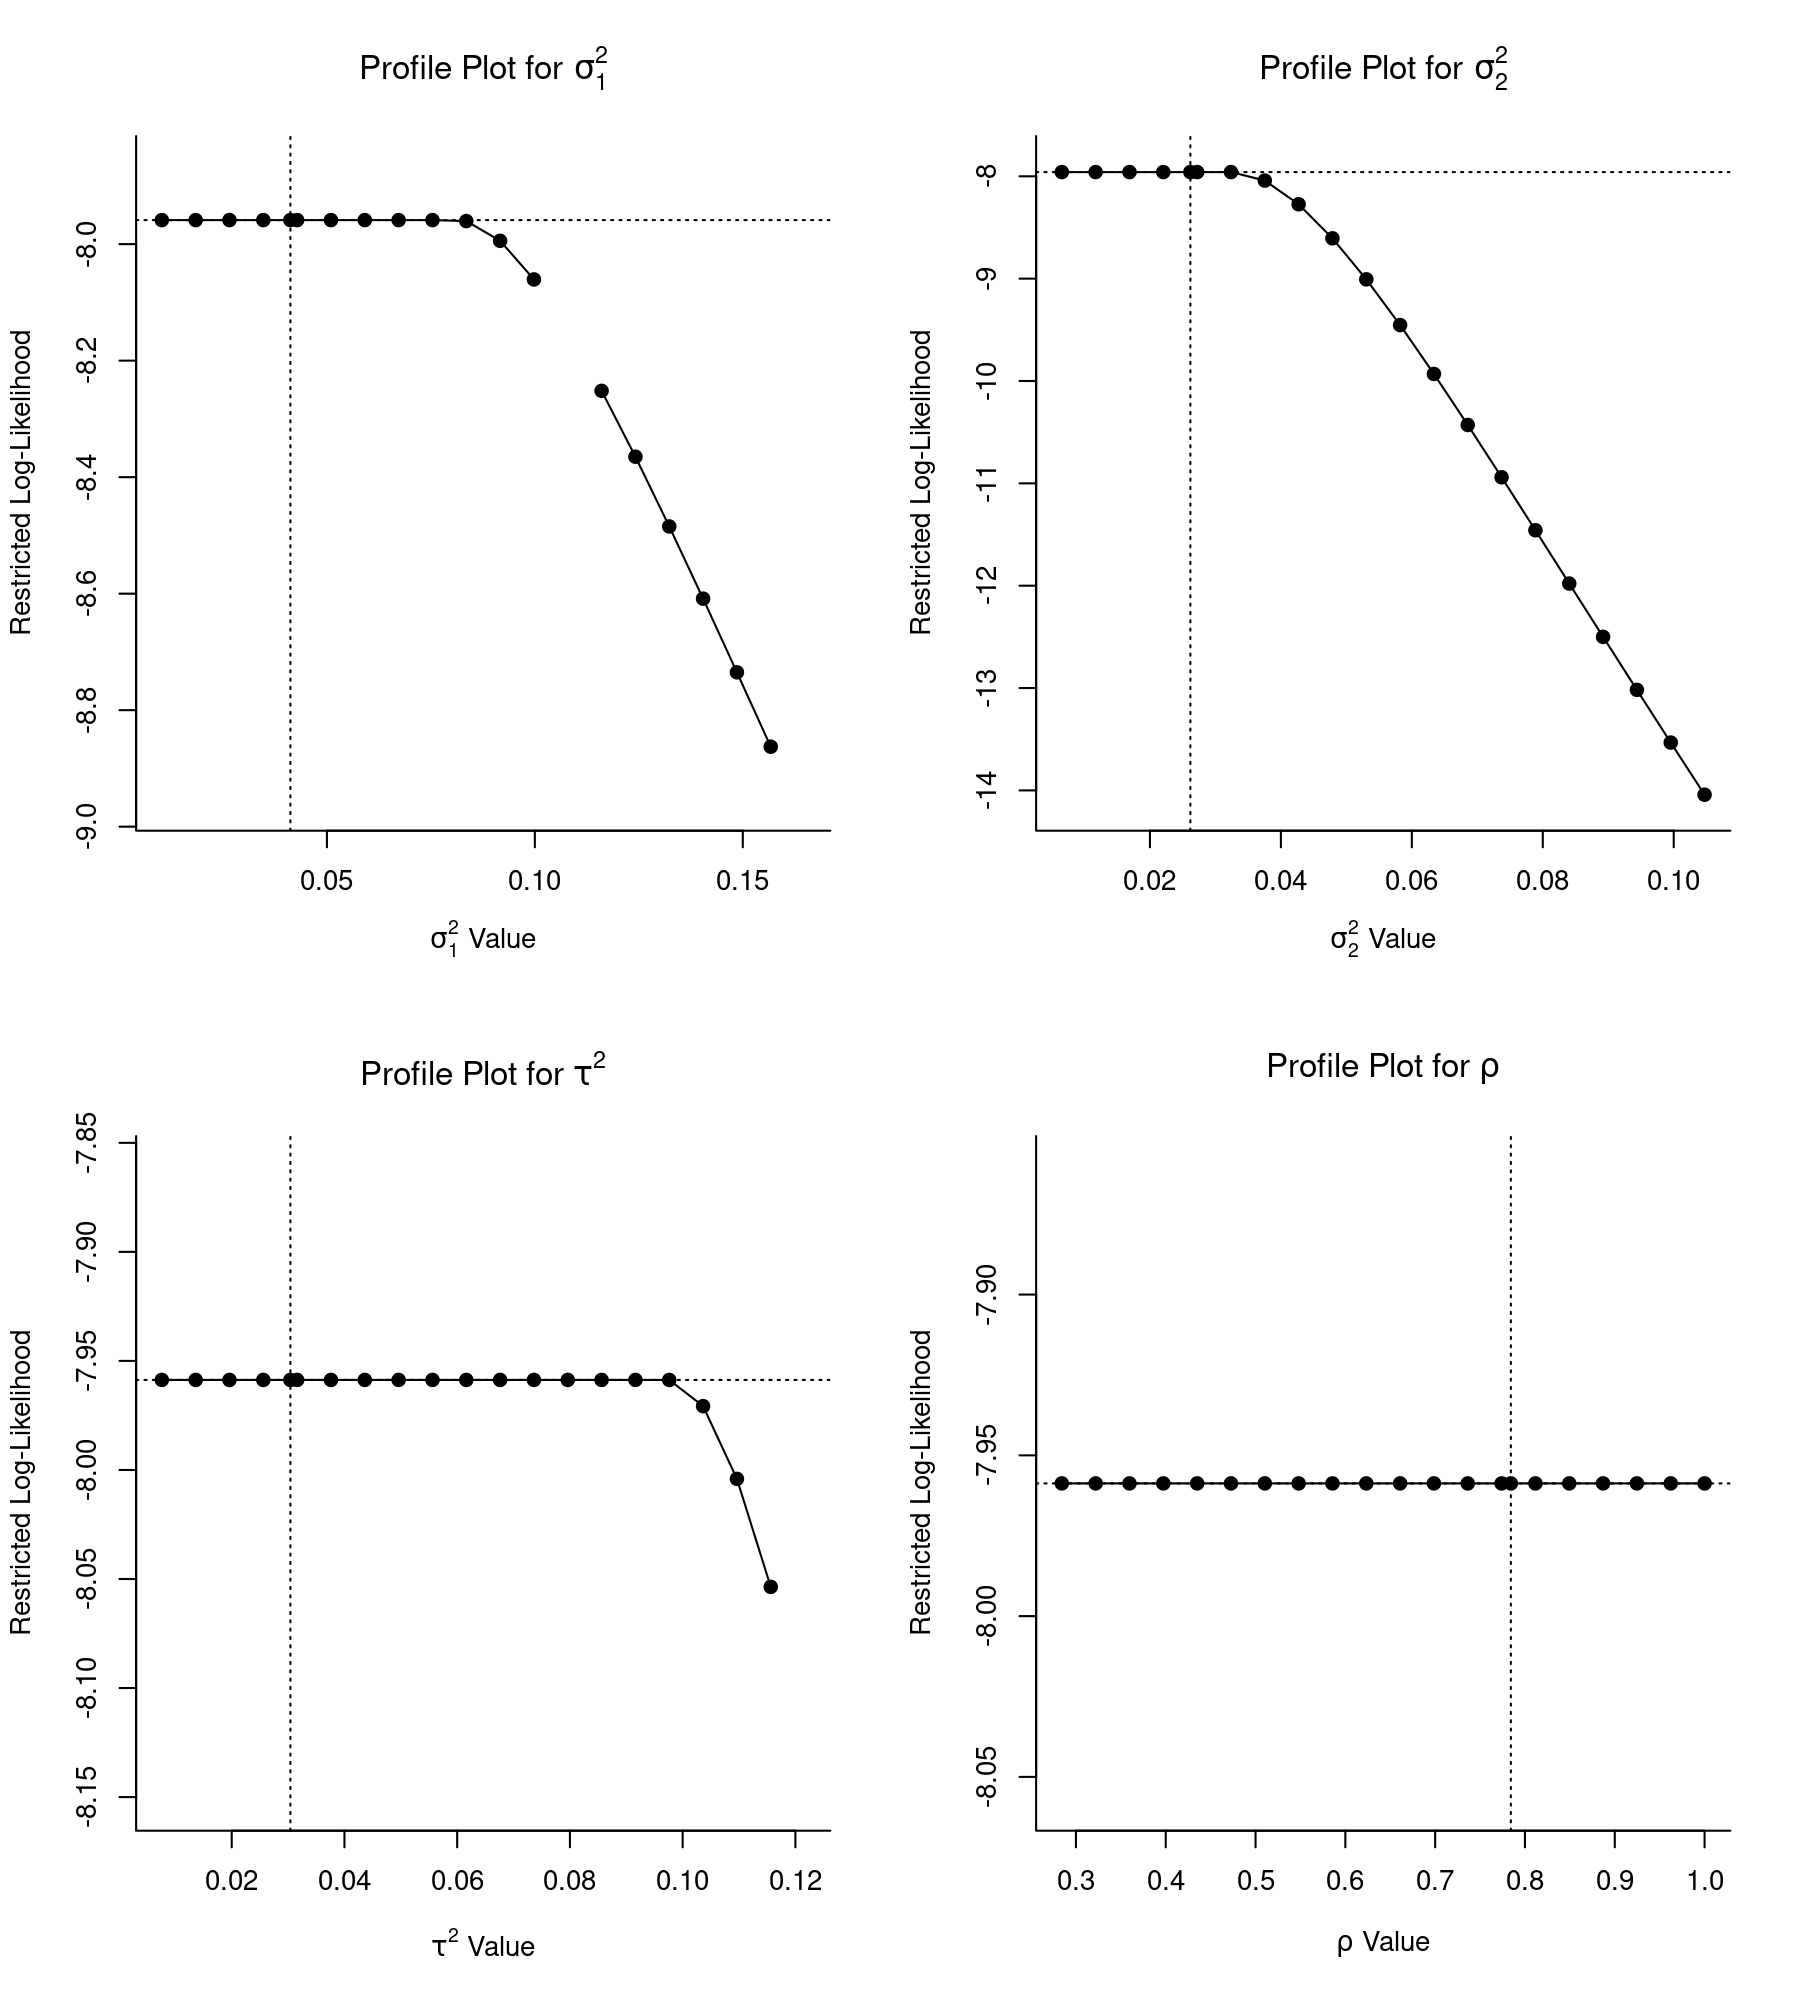
Note that large parts of the profiles are flat (and the profile for $\sigma^2_1$ shows some gaps, which indicates that the model did not converge for some of the profile points). These are clear indications that the model is overparameterized. In fact, despite the added complexity of the model, the fit of the model is exactly the same as for the multilevel and multivariate models fitted earlier:
logLik(res.op)
'log Lik.' -7.958724 (df=5)
In the present case, the estimate of the fixed effect and corresponding standard error (as shown under the Model Results) are also the same as the values obtained earlier. So, for making inferences about the fixed effects, things happen to work out okay in the overparameterized model. However, that may not be the case in other cases, so such models should be avoided.
References
Cooper, H., Valentine, J. C., Charlton, K., & Melson, A. (2003). The effects of modified school calendars on student achievement and on school and community attitudes. Review of Educational Research, 73(1), 1–52.
Konstantopoulos, S. (2011). Fixed effects and variance components estimation in three-level meta-analysis. Research Synthesis Methods, 2(1), 61–76.